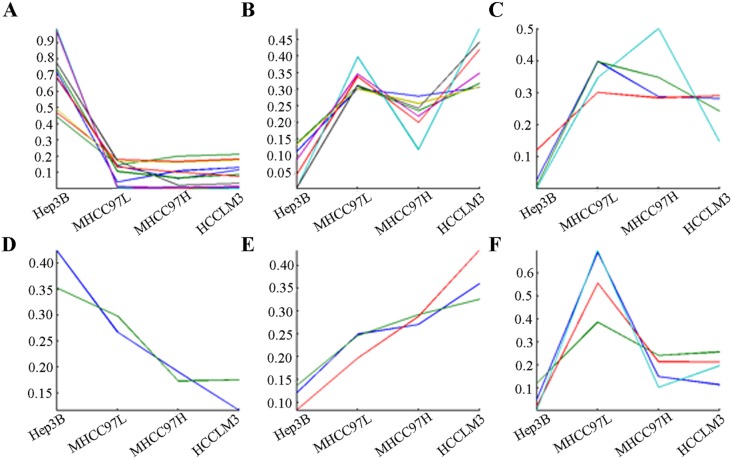
Figure 3. K-means clustering of differentially transcribed glycogenes.
Each line represented one differentially transcribed glycogene, the shape of lines displayed the expression trend of the differentially transcribed glycogenes in the no-metastatic HCC cell line Hep3B and the HCC cell lines with different metastatic potentials (MHCC97L, MHCC97H and HCCLM3).

