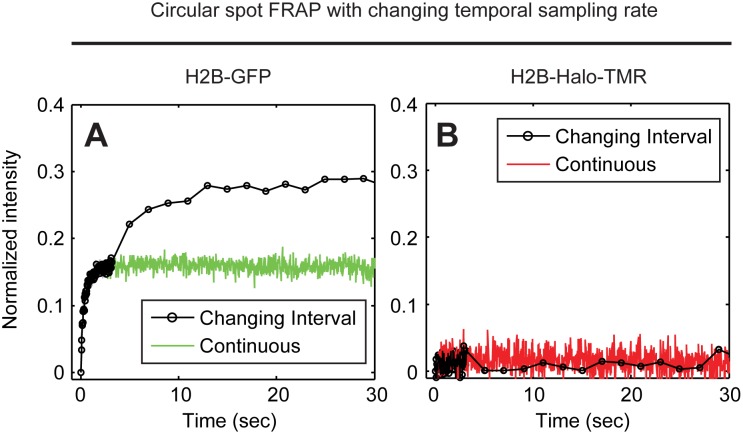
Figure 4. Artifacts in FRAP arising from alteration in the temporal sampling rate during the recovery phase.
H2B spot FRAP was performed as in Fig. 2C but now the temporal sampling rate was changed such that data after the photobleach were collected with no delay between images for the first 3 s after the photobleach and then with an interval of 2 s between images at the 3 s time point after the photobleach. With a constant sampling rate, the artifactual fast fraction of ∼15% for the GFP tag is equivalent to that in Fig. 2C (green curve, A), whereas with a change in temporal sampling rate the FRAP curve jumps upward leading to an even larger artifactual fast fraction (black curve, A). In contrast, the TMR-HaloTag shows no such effect with the red and black curves overlapping (B).

