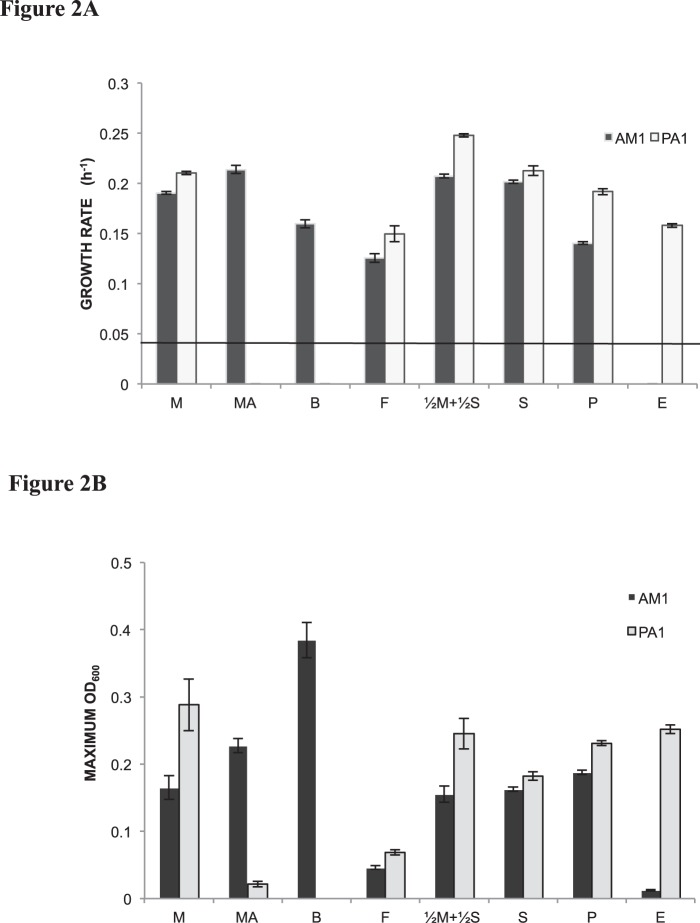
Figure 2. Quantitative comparison of growth rates and maximum OD600 values.
A) Growth rates for the Δcel ‘wild-type’ strain of AM1 (filled) versus the Δcel ‘wild-type’ strain of PA1 (open) on C1 substrates (M, 15 mM methanol; MA, 15 mM methylamine; F, 15 mM formate), the joint C1 and multi-C substrate betaine (B, 15 mM), multi-carbon substrates (S, 3.5 mM succinate; P, 5 mM pyruvate; E, 7.5 mM ethanol) and a combination of C1 and multi-carbon substrates (½M+½S, 1.75 mM succinate and 7.5 mM methanol). Error bars represent the 95% C.I. of the average of three biological replicates. The line indicates the approximate detection limit of our automated growth rate measurement device of 0.04 hr−1. Growth rates for PA1 on MA or B, and for AM1 on E were below this detection limit. B) Maximum OD600 for the Δcel ‘wild-type’ strain of AM1 (filled) versus the Δcel ‘wild-type’ strain of PA1 (open) on C1 substrates (M, 15 mM methanol; MA, 15 mM methylamine; F, 15 mM formate), the joint C1 and multi-C substrate betaine (B, 15 mM), multi-carbon substrates (S, 3.5 mM succinate; P, 5 mM pyruvate; E, 7.5 mM ethanol) and a combination of C1 and multi-carbon substrates (½M+½S, 1.75 mM succinate and 7.5 mM methanol). Error bars represent the 95% C.I. (confidence interval) of the average of three biological replicates.

