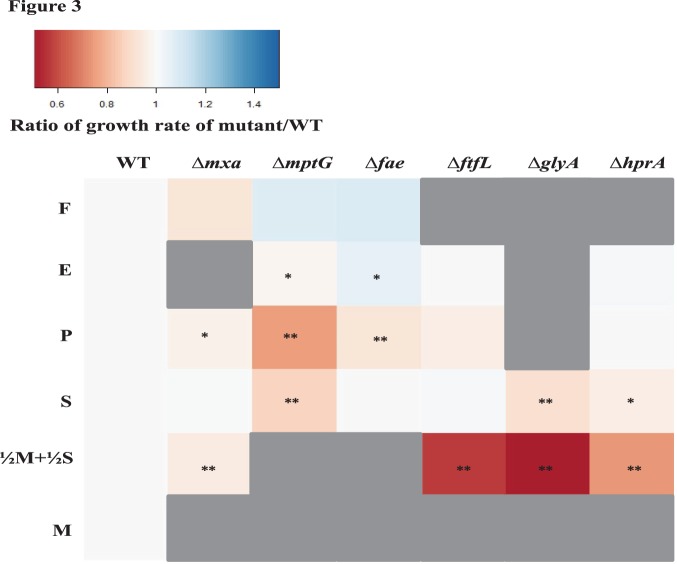
Figure 3. Heat map depicting the ratio of growth rate of knockout mutants of PA1 relative to the growth rate of the Δcel wild-type strain on C1 or multi-C substrates (same concentrations as in Figure 2 ).
Undetectable growth is indicated by grey. A significant difference (determined by comparing the mean growth rate of three biological replicates using the t-test) in growth rate with a p-value <0.05 is indicated by a * and a p-value <0.01 is indicated by **.

