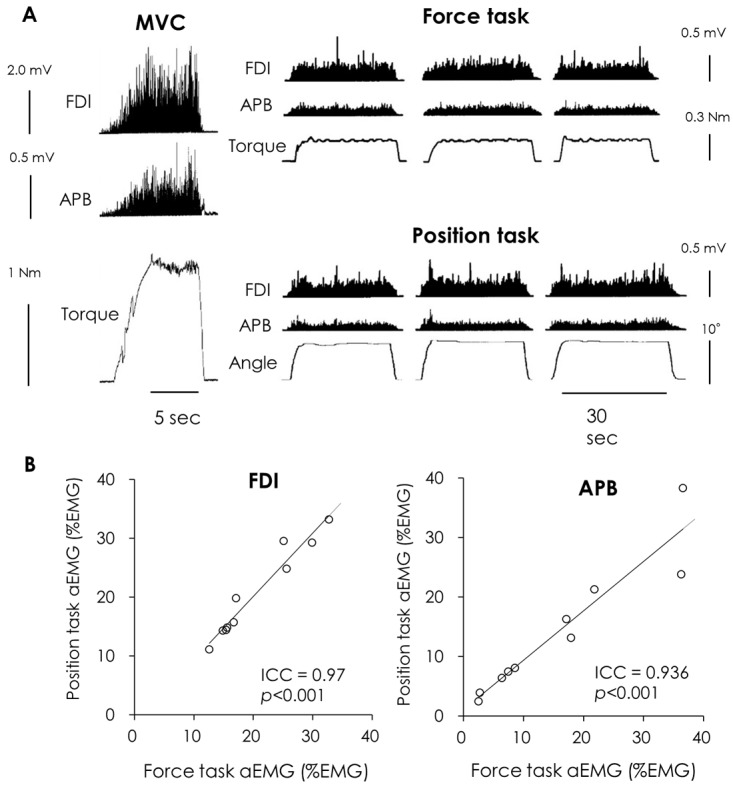
Figure 3. The EMG from the FDI and APB muscles, and the torque and/or angle waveforms recorded from a representative subject during MVC and isometric contraction when the subject maintained a constant finger force or position (A), and averaged amplitude of the rectified EMG signals (aEMG) from the FDI and APB muscles of the individual subjects for the two tasks (B).

Regression analysis showing the relationship between the aEMG of the force and position tasks. Most of the data fell on the regression line, indicating a very high reproducibility between the force and position tasks.
