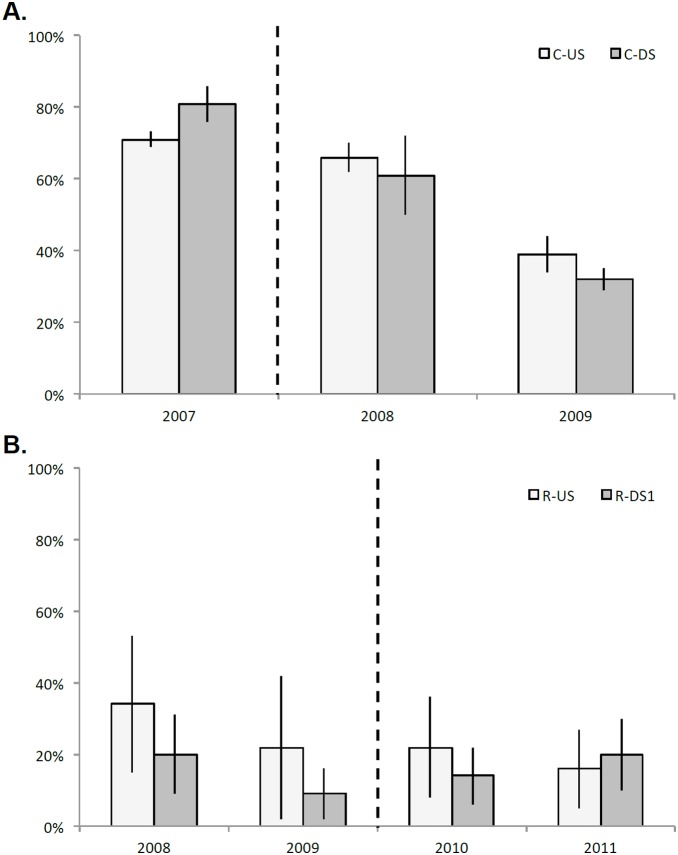
Figure 8. Mean %EPT (expressed as a proportion, +/−2 standard errors) per reach across A) riffle sample units on the Calapooia, and B) transects sampled on the Rogue.
In both panels, year is on the x-axis, and lighter-colored bars represent the upstream reaches. Vertical dashed line shows timing of dam removal. Note that the second downstream reach is not plotted for the Rogue River due to the lack of change over time.

