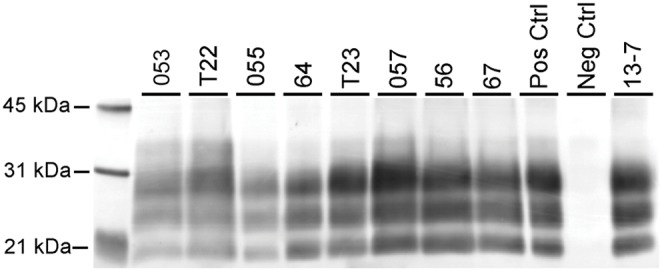
Figure 2. Western blot analysis demonstrating similar PrPSc profile in brainstem regardless of genotype when developed with mAb P4.

Note uniform 3-band molecular profile identical to inoculum (13-7) profile; individuals of VRQ/VRQ (sheep T22, T23), VRQ/ARR (sheep 64, 56, 67), ARQ/ARR (sheep 053, 055, 057) prion genotypes represented (see Table 1). Samples were loaded at varying concentrations between 0.06–0.24 mg equivalents of brain tissue per lane. Inoculum (No. 13-7) was loaded at 0.06 mg and the positive control was loaded at 0.03 mg. Molecular weight markers in kDa are indicated on the left side of the blot.
