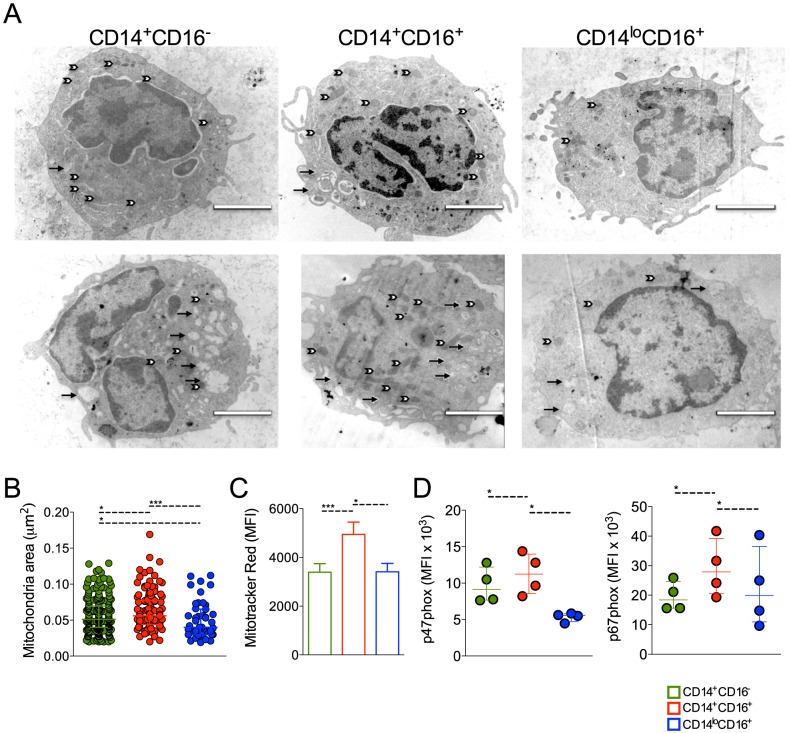
Figure 5. Circulating monocyte subpopulations display distinct morphology, mitochondrial and NADPH subunit content.
FACS-sorted CD14+CD16−, CD14+CD16+ and CD14loCD16+ monocytes from healthy donors and P. vivax-infected patients were fixed and prepared for electron microscopy. Monocyte subsets from a single healthy donor (A, upper panel) and a single patient (A, lower panel) shown are representative of the analysis of at least six cells of each monocyte subpopulation per patient and of the analysis of 5 controls and 6 patients. Mitochondria (white arrows) and vesicles (black arrows). Scale bar, 2 µm. (B) Mitochondria area from CD14+CD16− (green circles), CD14+CD16+ (red circles) and CD14loCD16+ (blue circles) monocytes was assessed using ImageJ. Circles indicate individual mitochondria. (C) Mitochondria content in CD14+CD16− (green bars), CD14+CD16+ (red bars) and CD14loCD16+ (blue bars) monocytes from P. vivax-infected patients was measured based on Mitotracker reactivity (n = 11). (D) Mean fluorescence intensity (MFI) of p47phox and p67phox within CD14+CD16−, CD14+CD16+, CD14loCD16+ monocytes from P. vivax-infected patients was measured by flow cytometry 3 hours after culture in medium alone or P. vivax-infected reticulocytes (n = 4). Results are representative of 2 independent experiments. Symbols represent individual subject. *p<0.05, ***p<0.01.

