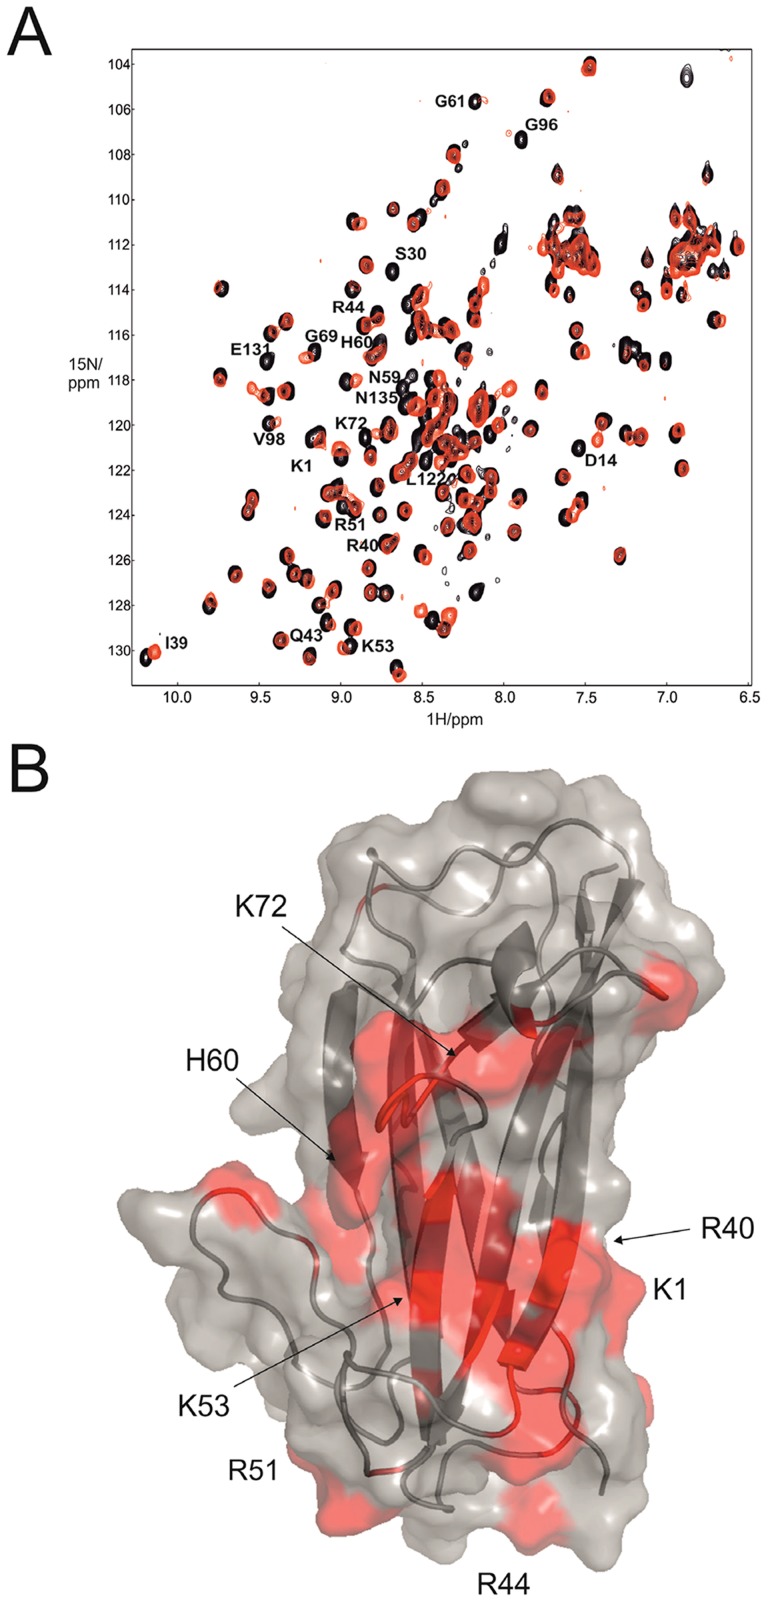
Figure 4. Fibronectin binding site mapping using NMR.
(A) Overlaid 1H-15N HSQC NMR spectra for free AafAdsA (black) with two molar equivalents of fibronectin (red). Residue labels represent mature protein sequence numbering. (B) Map of chemical shift perturbations on the structure of subunit. Key basic residues are highlighted.

