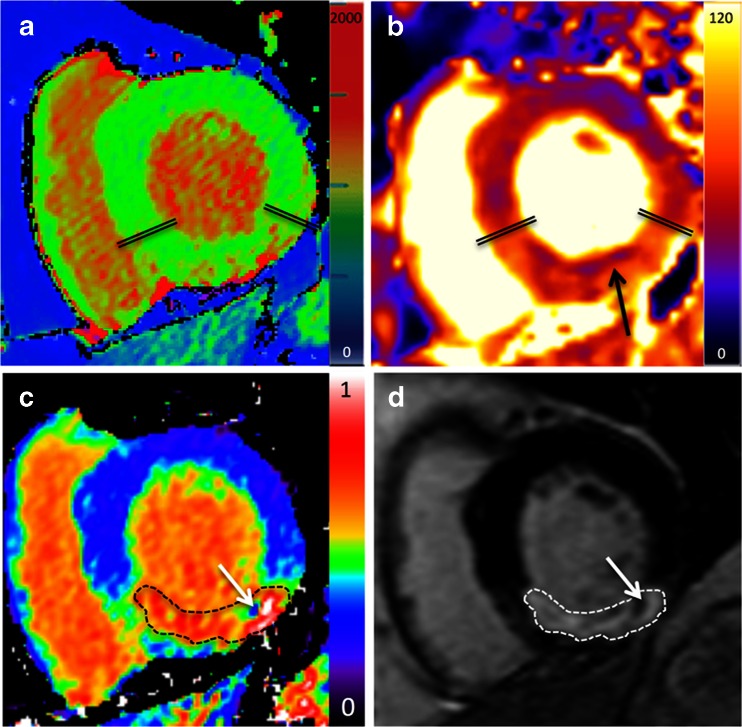
Fig. 1.
Multi-parametric imaging in acute myocardial infarction. Basal short axis slice in a patient scanned 3 days after acute inferior myocardial infarction. Native (ShMOLLI [54•]) T1 maps (a) and T2 maps (b) show elevated values in the area-at-risk (myocardium between double lines); an ECV map (c) shows the highest ECV values corresponding to the area of late gadolinium enhancement (d) or acute infarction. Intra-myocardial hemorrhage can be identified by low T2 values in the core of the risk zone (thin black arrow). A small area of microvascular obstruction in (d) does not allow contrast to enter and appears as a core of low ECV values in (c) (thin white arrows)

