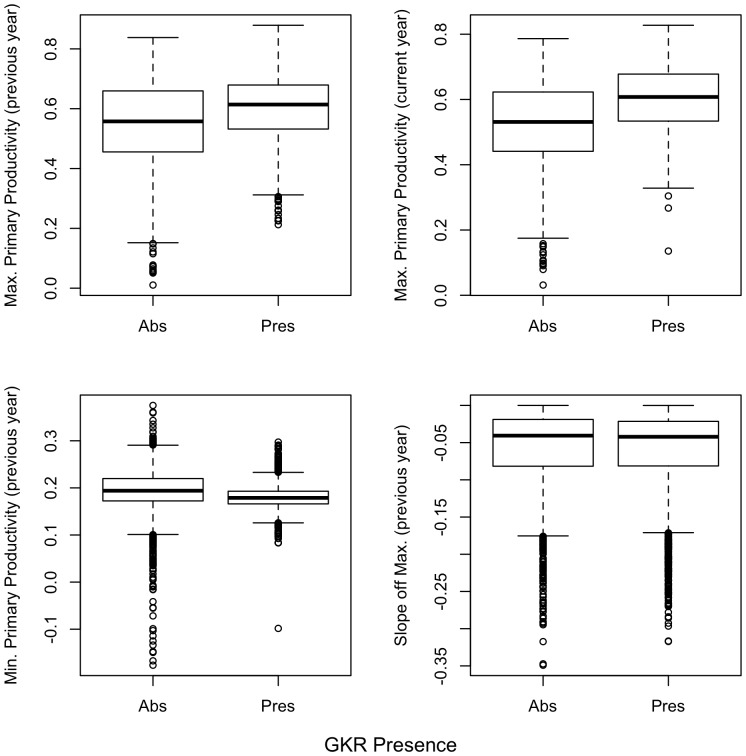
Figure 2. Relationships between primary productivity (measured as NDVI) and GKR presence.
GKR were expected to have a positive relationship with maximum primary productivity in the previous and current year; a negative relationship with the minimum primary productivity measured in the previous year; and a negative relationship with the rate of decrease of primary productivity in the previous year. Relationships are shown from 500 random points estimated from aerial surveys in 2011. All differences were significant (t-test, p<0.05).

