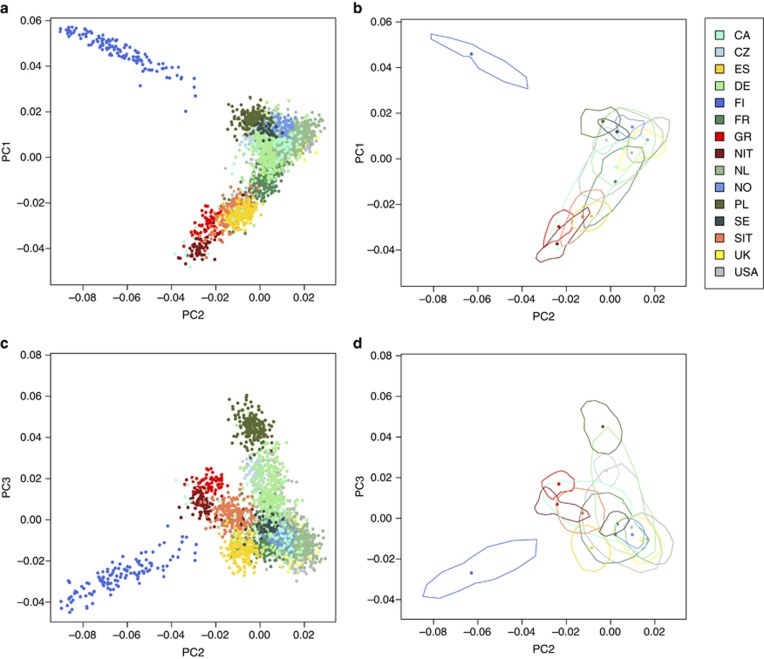
Figure 2.
Fine structure between the 15 European populations studied. (a) Fine structure across all populations: PC1 versus PC2. (b) The distribution of samples is shown for each population. Outlying samples (deviating in location by more than 3 SDs from the mean) were excluded. A three-point moving average filter was used to smooth outlines. (c) Fine structure across all populations: PC2 versus PC3. (d) The distribution of samples is shown for each population, calculated as in (b). CA, Canada; CZ, Czech Republic; DE, Germany; ES, Spain; FI, Finland; FR, France; GR, Greece; NIT, North Italy; NL, Netherlands; NO, Norway; PL, Poland; SE, Sweden; SIT, South Italy; UK, United Kingdom; USA, United States of America

