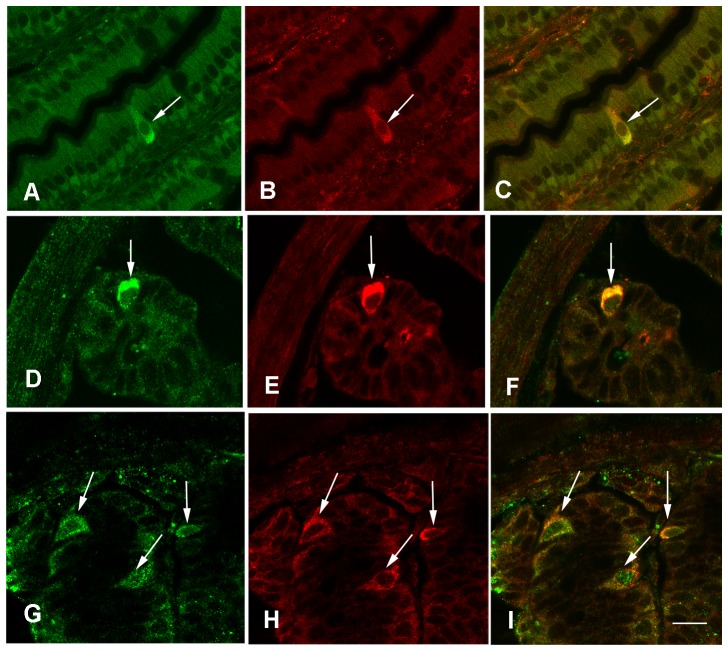
Figure 3. Cells Expressing T2R138 in the Gut.
Confocal images of mouse ileum showing colocalization of T2R138 (green) (A) with α-Gustducin (red) (B) immunoreactivity; C: shows overlay of both T2R138 and α-Gustducin immunoreactivity. D–I: Confocal images showing colocalization of T2R138 (green) (D, G) with chromogranin A, a marker of enteroendocrine cells (red) (E, H) and overlay of both immunoreactivities in the same cells (F,I) in the ileum (D–F) and distal colon (G–I). Calibration bar: 20 µm.

