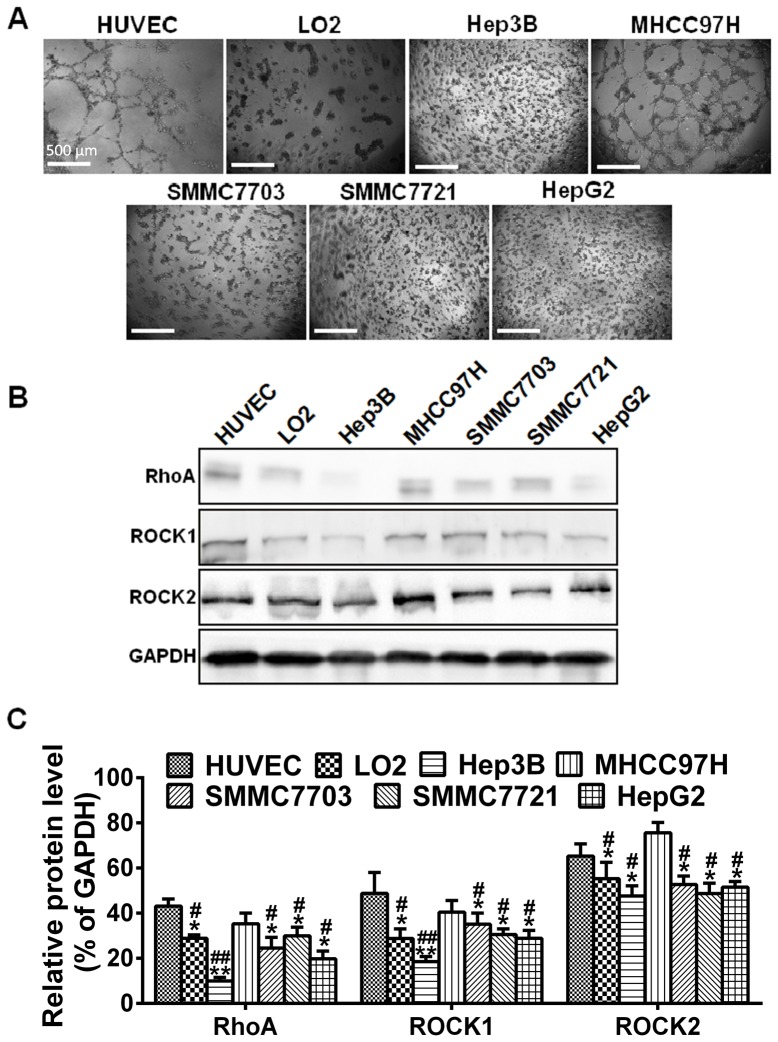
Figure 1. VM capacity and expression of RhoA, ROCK1 and ROCK2 in HCC cell lines.
(A) Formation of tubular network structures on Matrigel by HUVEC and LO2 compared to HCC cell lines. Cells were seeded into Matrigel-coated 24-well plates and incubated at 37°C. Photographs were taken after 24 h, with original magnification of 40×, scale bars represent 500 µm. (B) Western blot was performed to confirm the protein expression of RhoA, ROCK1 and ROCK2 in HCC cell lines and LO2, using HUVEC as a positive control. (C) Relative densities (RD) are presented as mean ± S.E. (n = 3) of the fold change relative to the internal control. GAPDH was used as an internal control for protein loading. *P<0.05 and **P<0.01 vs. HUVEC and # P<0.05 and ## P<0.01 vs. MHCC97H.

