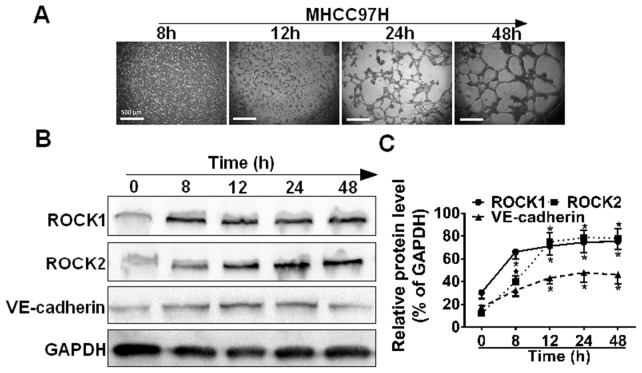
Figure 3. ROCK expression is consistent with the process of VM formation.
(A) Formation of tubular network structures on Matrigel over 48 h. MHCC97H cells were subjected to Matrigel and photographed at 8, 12, 24 and 48 h, scale bars represent 500 µm. (B) Cell lysates from MHCC97H cells were seeded onto matrigel at the indicated time points and western blotted. (C) Relative protein level of each condition was quantitated using Image J and represented as line chart corresponding to pixels detected, (n = 3).

