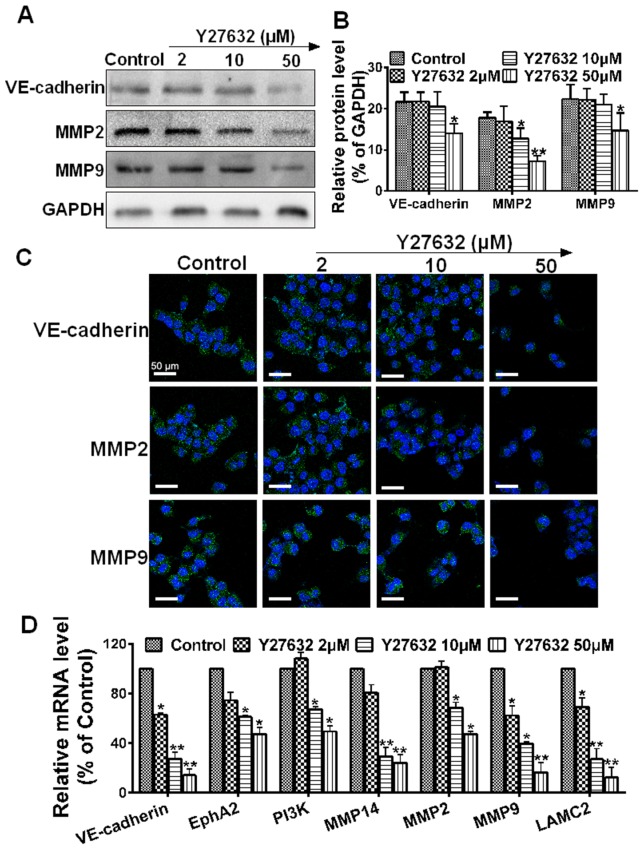
Figure 5. The effect of ROCK inhibition on the expression of VM-key factors.
(A) Western blot assay was performed to evaluate the effect of ROCK inhibition on VM markers. (B) Relative protein level was quantitated using Image J (*P<0.05 and **P<0.01, ROCK inhibitor groups vs. the control, using GAPDH as an internal control for protein loading. (C) Representative confocal images (n = 3, five pictures per condition) of control and Y27632 (2, 10 or 50 µM) with 24 h incubation, after immunostaining for VE-cadherin, MMP2 or MMP9 (green) and the nuclear dye DAPI (blue), scale bars represent 50 µm. (D) Real-time qPCR analysis was used to determine changes in gene expression. Relative Y27632-induced change in gene expression compared with GAPDH is expressed as fold change calculated by 2-ΔΔCp method. Data are expressed as mean ± S.E. from three independent experiments, with significant differences from control shown as *P<0.05 and **P<0.01.

