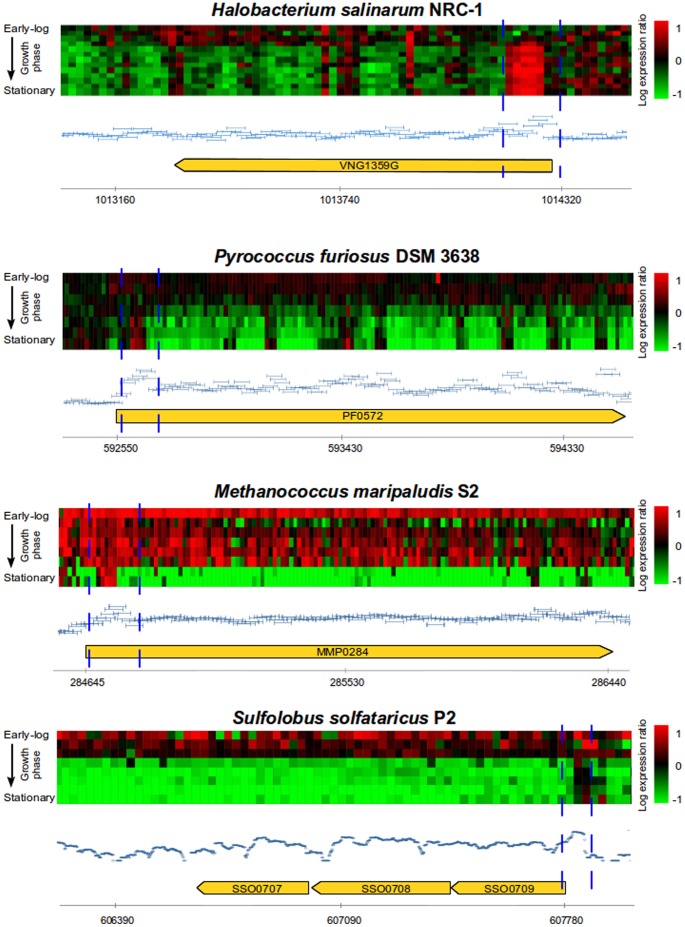
Figure 1. Data-mining on archaeal gene expression public datasets.
Each panel shows an example of TSSaRNA presence in different archaeal transcriptomes. Yellow arrow represents the cognate gene, blue dashed lines represent TSSaRNA estimated regions and horizontal axis represent organism's genome coordinates. Heatmaps represent gene expression profiles over growth curves and are color-coded according to log10 expression ratios between each time point relative to reference condition. Light blue horizontal bars represent tiling array probe intensities for reference conditions for H. salinarum, P. furiosus and M. maripaludis. Dark blue points (S. solfataricus only) represent RNA-seq reads coverage data. Figure S1 show examples for additional archaea.

