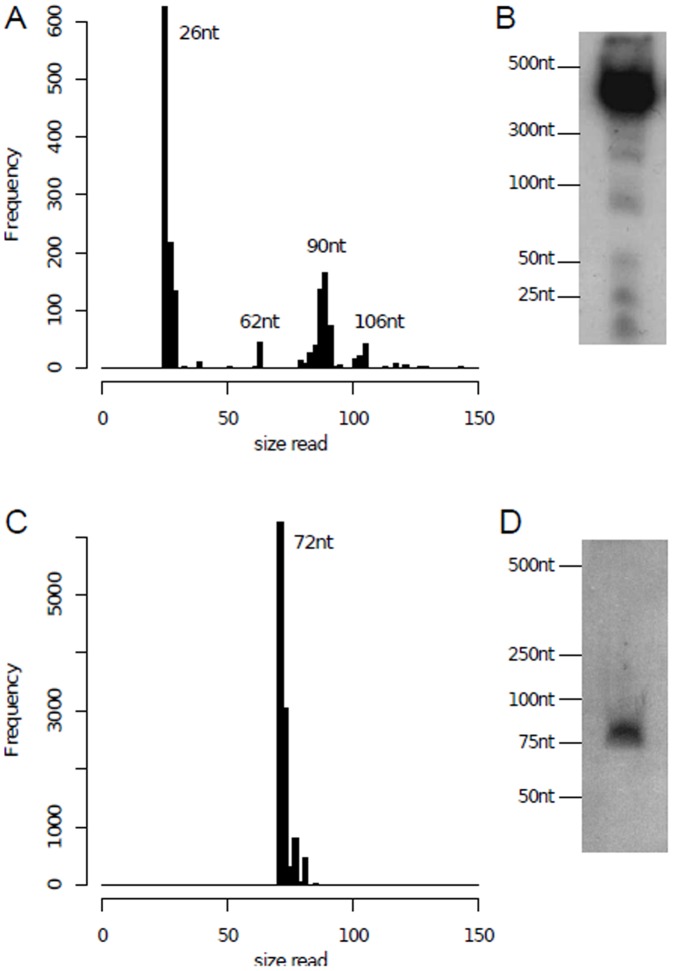
Figure 3. TSSaRNAs reads size distribution and northern blot validation.
Panel A shows the size histogram of all reads that aligned their 5′ ends at VNG0101G's TSS. It is possible to verify an enrichment of sizes of 26 nt, 62 nt, 90 nt and 106 nt, which corresponds to the bands observed in the northern blot experiment. Panel B shows northern blot analysis for TSSaRNA associated with VNG0101G. Panel C shows the size histogram of all reads that aligned their 5′ ends at VNG1213C's TSS. Panel D shows northern blot analysis for TSSaRNA associated with VNG1213C.

