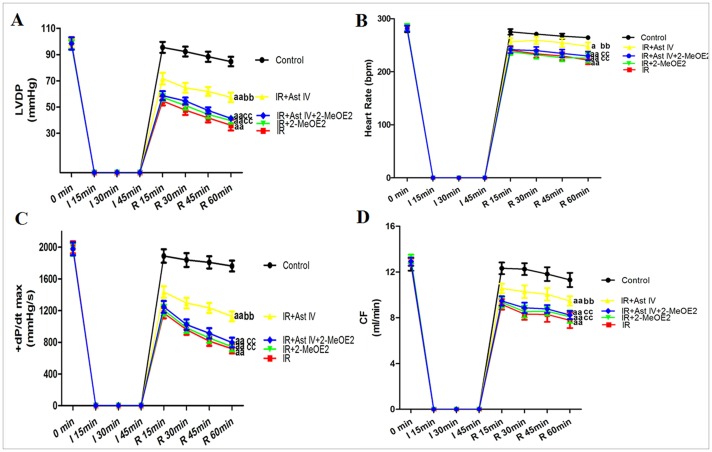
Figure 5. The effects of Ast IV and 2-MeOE2 post-ischemia treatment on cardiac function of IR-injured isolated hearts.
(A). Representative line graph for the LVDP curve. (B). Representative line graph for the HR curve.(C). Representative line graph for the +dP/dt max curve. (D). Representative line graph for the CF curve. The results are expressed as the mean±SEM, n = 6. aP<0.05 vs. Control; aaP<0.01 vs. Control; bP<0.05 vs. IR; bbP<0.01 vs. IR; cP<0.05 vs. IR+Ast IV; ccP<0.01 vs. IR+Ast IV. IR, ischemia reperfusion; Ast IV, Astragaloside IV; 2-MeOE2, 2-methoxyestradiol; HR, heart rate; LVDP, left ventricular peak developing pressure; +dP/dt max, the maximum rate of pressure change in the ventricle; CF, coronary flow.

