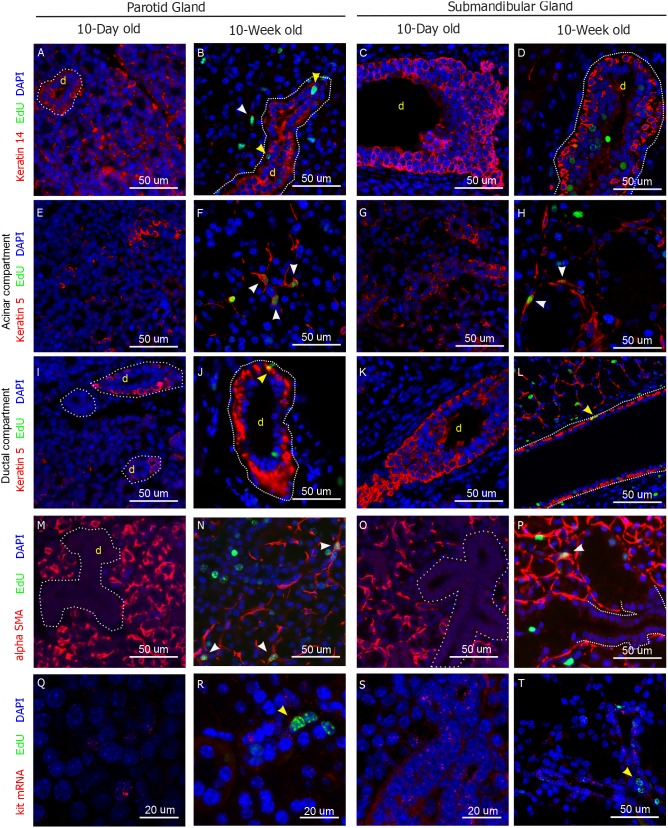
Figure 2. Molecular markers in salivary gland LRCs.
Representative images of parotid and submandibular glands of 10-day old and 10-week old animals stained for Keratin 14 (A–D), Keratin 5 (E–L), Smooth Muscle alpha Actin (M–P). Q–T) Fluorescence in Situ Hybridization for kit mRNA. EdU LRCs are shown in green, DAPI in blue, and all other markers in red. White arrowheads point at co-localization of each marker with the LRCs in the acinar compartment. Yellow arrowheads point at co-localization of each marker with the LRCs in the ductal compartment. Full size images of every panel are shown in Figure S2.

