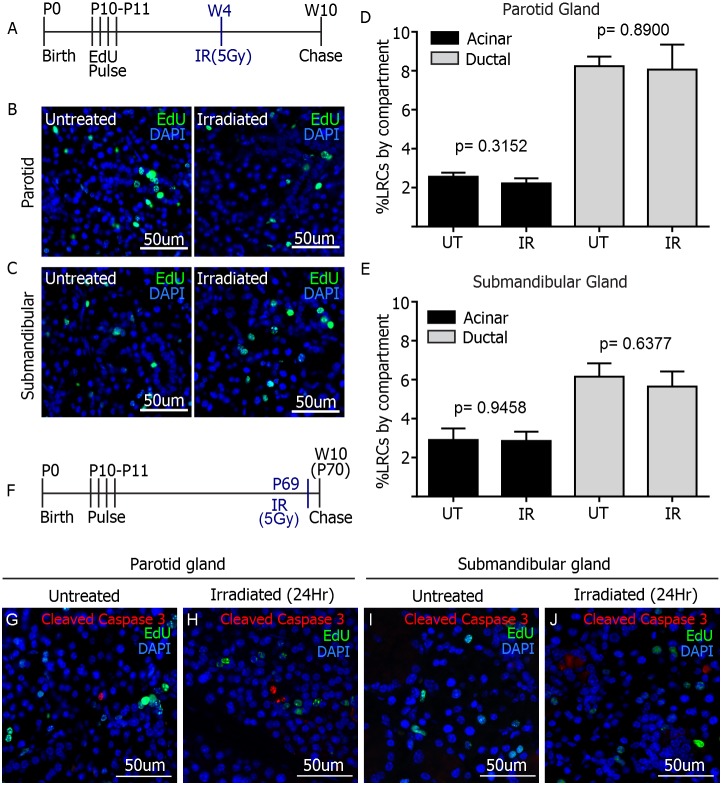
Figure 6. Effect of radiation on salivary gland LRCs.
A) Experimental setup. A single 5 Gy dose of radiation was given at week 4 to EdU-pulsed animals (n = 7). Tissue was collected at week 10. Representative images of EdU staining of parotid (B) and submandibular (C) glands are shown for irradiated animals and untreated controls. EdU positive cells were quantified manually per individual compartment for both treatments and expressed as percentage of LRCs per compartment for both glands (D–E). P values were obtained with 2-sided unpaired t-test per compartment (n = 7 for irradiated groups, n = 12 for parotid untreated control group and n = 6 for submandibular untreated control group). F) Experimental setup. 5 Gy dose of radiation treatment was given 24-hours prior tissue collection to EdU-pulsed animals (n = 3). G–J) Immunofluorescence staining of Activated Caspase-3 (red) and EdU (green) in parotid and submandibular glands. No co-localization is observed.

