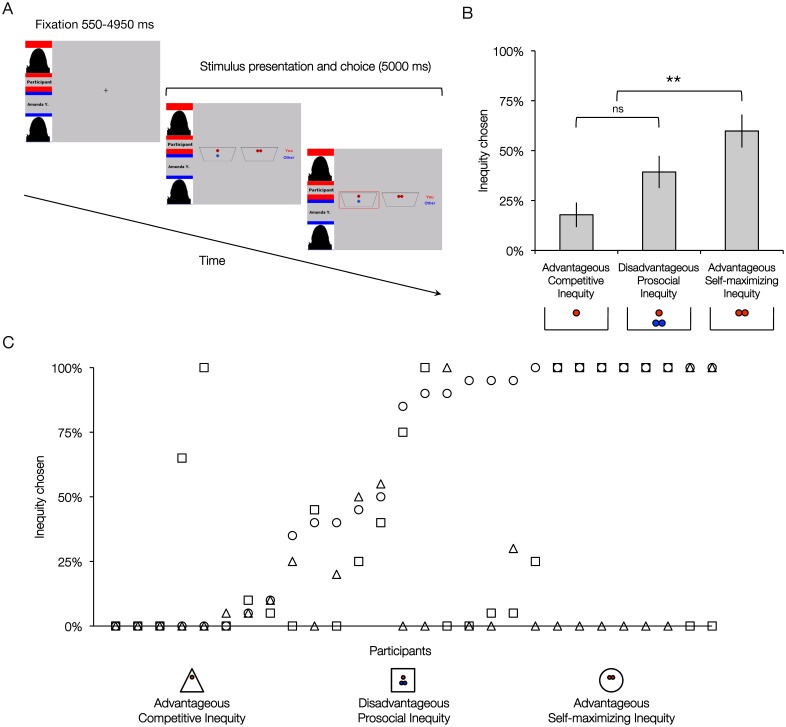
Figure 1. Visual display of the fMRI task and frequency of inequity choices.
(A) Visual display of events presented in the one trial of the fMRI task. Each trial started with a jittered fixation cross lasting 550–4950 ms. The following screen displayed the name of the participant in red (here ‘Participant’) and the name of the recipient (here ‘Amanda Y.’). This screen also presented the available choice options for distributing the coins (here Advantageous Self-Maximizing Inequity game; 1/1 vs 2/0) with red and blue coins indicating the share for the participant and the recipient, respectively. The participant had a maximum response time of 4000 ms to make a choice. Upon response, the chosen distribution was encircled in red (here 1/1) until the end of the 5000 ms. (B) Percentage of inequity choices made in each of the three games. **p<.001, *p<.05. (C) Percentage of inequity choices made by each participant in each of the three games.

