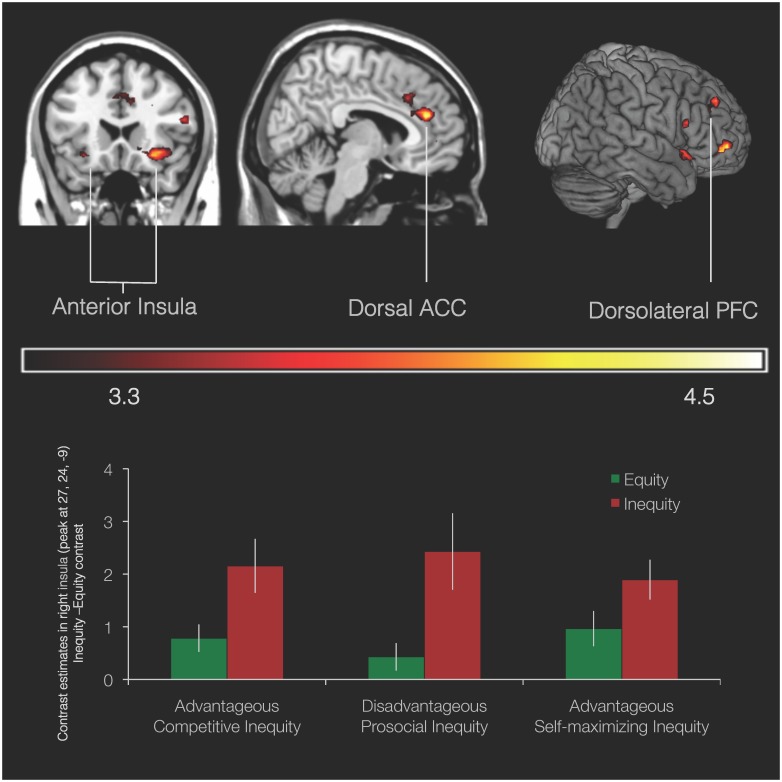
Figure 2. Neural network associated with inequity.
Network of brain regions from the Inequity > Equity contrast in the 3 (Game) ×2 (Choice) full factorial ANOVA; p<.001, 10 voxel threshold. Bar graph displays contrast estimates obtained from ROI analysis in right anterior insula (MNI 27, 24, −9) for inequity and equity choices in the three conditions. Error bars indicate SEM.

