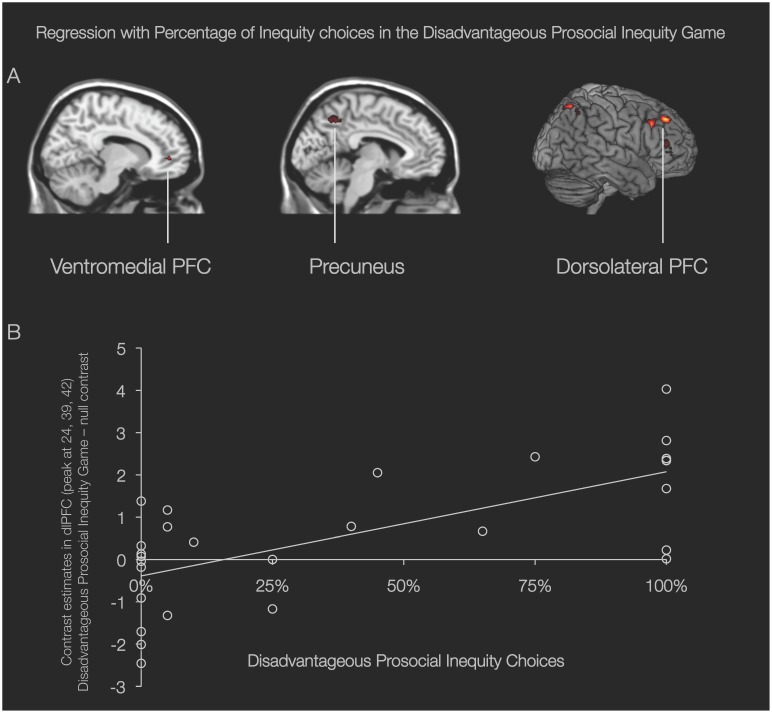
Figure 4. Neural network related to frequency of inequity choices.
Brain regions from the regression of neural activity during the Disadvantageous Prosocial Inequity game with frequency of inequity choices. (A) Activation in the ventromedial PFC (MNI 15, 45, 0), precuneus (MNI -9, -57, -48), and dorsolateral prefrontal cortex (dlPFC; MNI 24, 39, 42) correlates positively with the frequency of inequity choices in the Disadvantageous Prosocial Inequity condition; p<.001, 10 voxel threshold. (B) Scatter plot displays contrast estimates for the Disadvantageous Prosocial Inequity condition on the y-axis and behavior (% inequity) on the x-axis (N = 28).

