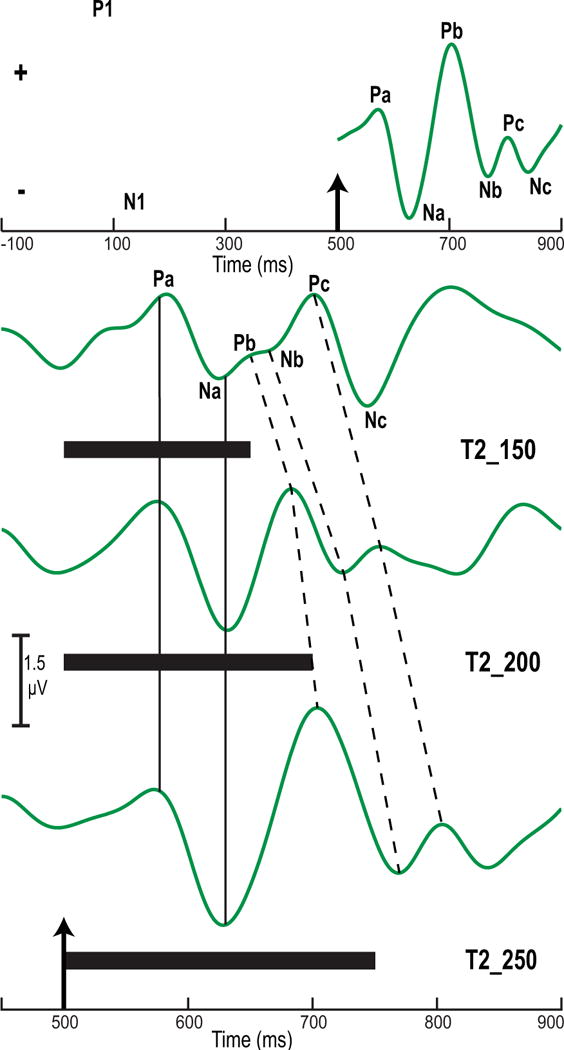
Figure 3.

Grand averaged cortical evoked response components at the Fz electrode site per stimulus condition. The P1/N1 onset complex for the three stimuli (black) and the CPR component to T2_250 (green) are displayed in the top panel. The up arrow at 500 ms marks the boundary between the noise precursor segment and the pitch-eliciting stimulus. Na, Pb, and Nb are the most robust response components. CPR waveforms (green) elicited by the three stimuli (T2_150, T2_200, T2_250) are shown in the bottom panel. The up arrow at 500 ms marks the beginning of the pitch-eliciting stimulus. Solid black horizontal bars indicate the duration of each stimulus. Whereas Pa and Na do not change across stimuli (solid vertical lines), Pb, Nb, Pc, and Nc all show a systematic increase in peak latency (dashed vertical lines). Response amplitude for Na, Pb, and Nb increases from T2_150 to T2_250 in conjunction with decreasing pitch acceleration and increasing duration across stimuli.
