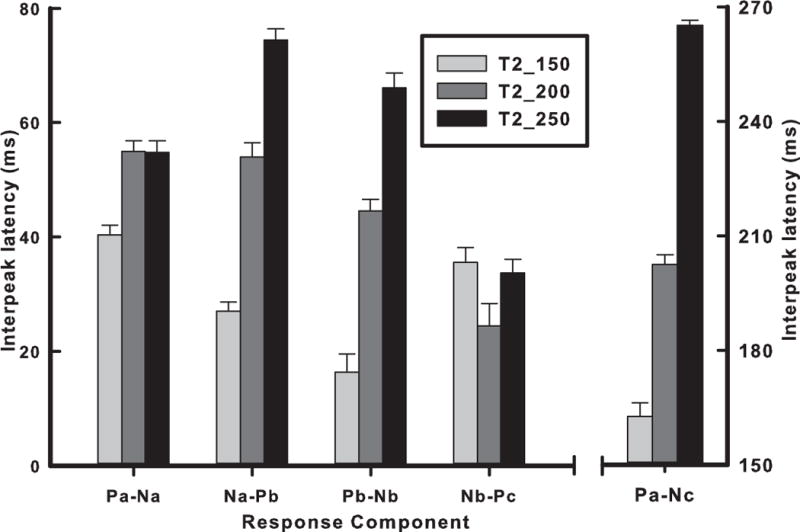
Figure 5.

Mean interpeak latency of Fz response components as a function of stimulus. Two pitch-relevant components (Na-Pb, Pb-Nb) are strikingly similar with proportionate increases in interpeak latency from T2_150 to T2_250 (left four response components). Pa-Na (sound onset to pitch onset) reveals that the interpeak latency of T2_150 is shorter than either T2_200 or T2_250. In the case of Nb-Pc, T2_200 is shorter than either T2_150 or T2_250. Pa-Nc is most accurate in tracking the onset and offset of the stimulus (rightmost response component). Error bars = ±1 SE.
