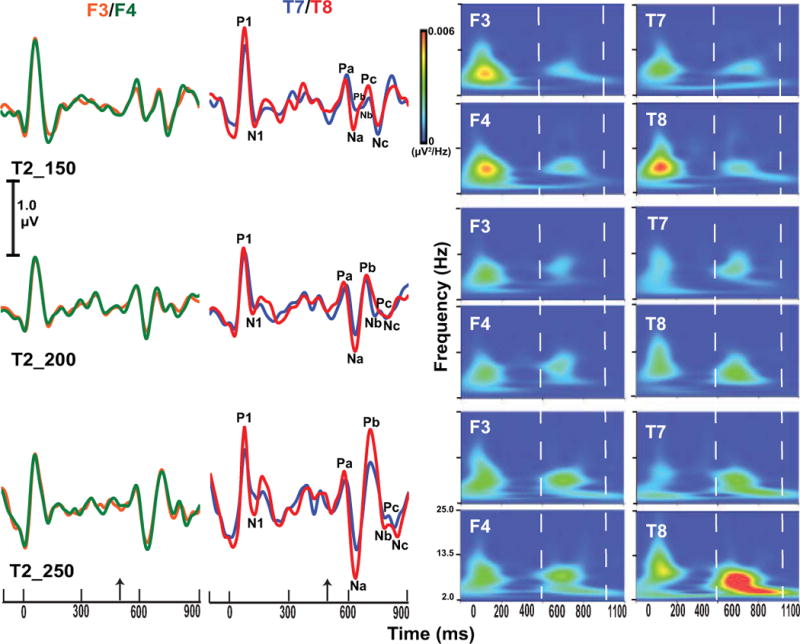
Figure 8.

Grand averaged cortical evoked response waveforms (left side) for the frontal F3 (orange) and F4 (green) and for the temporal T7 (blue) and T8 (red) electrode sites per stimulus condition. The upward arrow on the time axes denotes the onset of the pitch segment. The P1/N1 onset complex and the CPR components (Pa, Na, Pb, Nb, Pc, Nc) are identified. Responses at the frontal sites (F3, F4) essentially overlap; responses at the temporal sites, however, show larger responses at T8 compared to T7 for both T2_200 and T2-250. Spectrograms (wavelet analysis) at frontal and temporal electrode sites (right side) reveal the robust rightward asymmetry in spectrotemporal activity in response to T2_250 within the Na-Pb and Pb-Nb time windows (demarcated by two vertical dashed lines). See also caption to Fig. 3.
