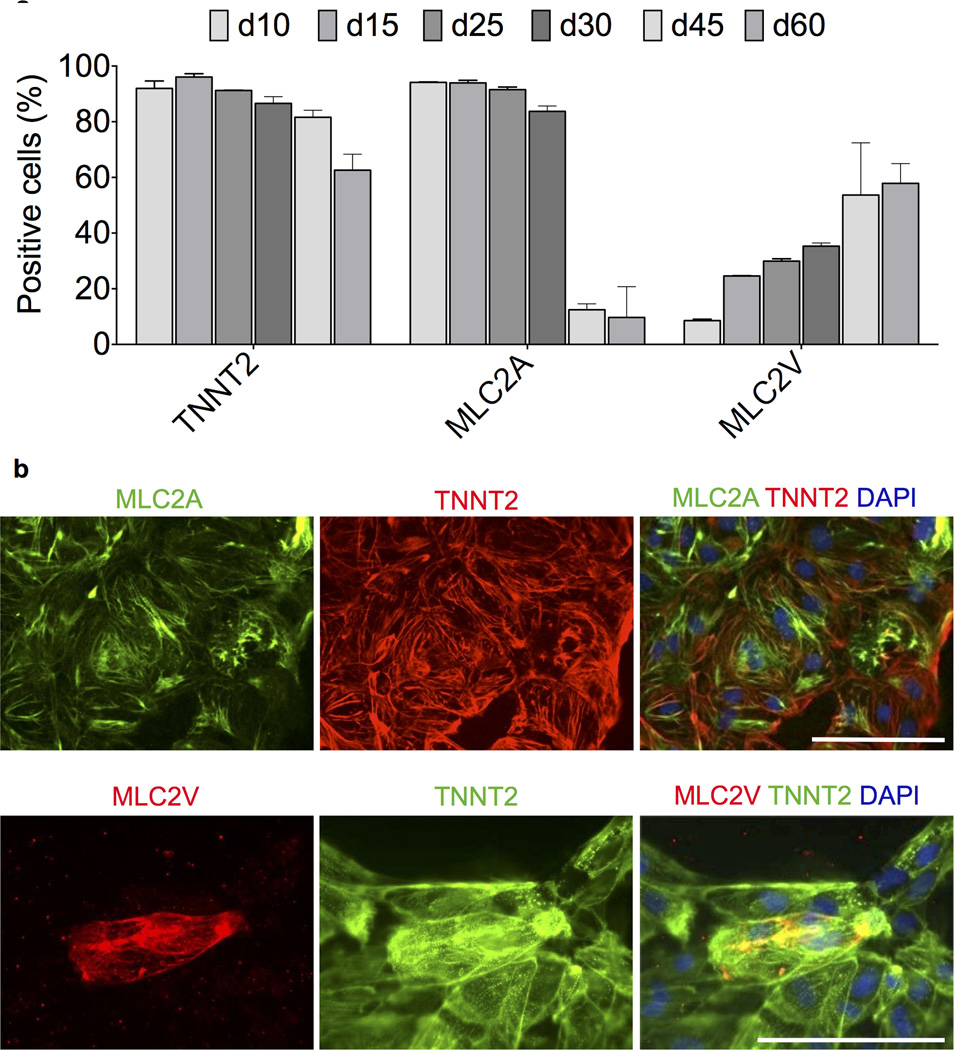
Figure 3.
Characterization of atrial vs. ventricular profile of cardiomyocytes produced under chemically defined conditions. a) Flow cytometry assessment of expression of cardiac troponin T (TNNT2), atrial myosin light chain 2 (MLC2A), and ventricular myosin light chain (MLC2V) in cardiomyocytes derived and maintained in CDM3 at differentiation from day 10 through day 60, n = 3. Error bars represent S.E.M. Additional data is provided in Supplementary Figs. 11 and 12. b) Immunofluorescence staining of day 20 cardiomyocytes with the same antibodies used for flow cytometry to demonstrate specificity. Scale bar, 12.5 µm.

