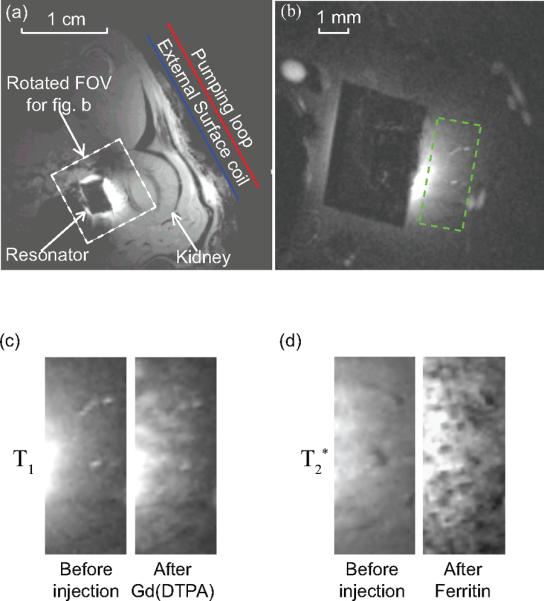
Fig. 2.

Axial images of a rat kidney obtained by Gradient Refocused Echo sequence. (a) A low resolution image acquired without parametric amplification to locate the position of the parametric resonator, with the following acquisition parameters: TE = 6 ms, TR = 357 ms, FA = 30 deg, NS = 1, in-plane resolution 156 × 156 μm2, FOV = 4 × 4 cm2, slice thickness = 1 mm. (b) A representative example of high resolution image acquired in the presence of parametric amplification, with a FOV defined by the white dashed box (a). The readout direction for image acquisition is aligned approximately perpendicular to the external pick up loop to filter out the intense surface signal. The acquisition parameters for high resolution T1-weighted images are: TE = 3.6 ms, TR = 37.4 ms, FA = 40 deg, in-plane resolution = 70 × 70 μm2, FOV = 9 × 9 mm2, slice thickness = 0.2 mm, NEX = 40 (experiment time = 3.2 mins). The acquisition parameters for T 2*-weighted images are: TE = 10 ms, TR = 58 ms, FA = 20 deg, experiment time = 5.8 mins, with other parameters remaining the same as T1-weighted images. The black rectangular region in the center of (b) is the PDMS coated resonator. the region of interest defined by the green dashed box. (c) High resolution T1-weighted image before and after the injection of a bolus Gd(DTPA) of 5 μmol/kg of body weight, showing the region of interest defined by the green dashed box in (b). (d) High resolution T 2*-weighted image before and after the injection of a bolus cationized ferritin of 113 mg/kg of body weight.
