
Fig. 2.
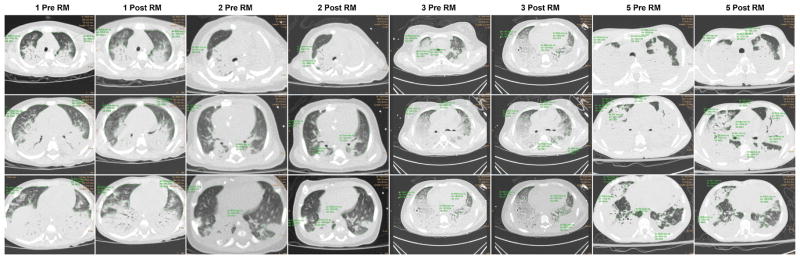
Computed tomography scan of subjects 1, 2, 3, and 5 shows variable increase in lung aeration following lung recruitment. The region of aerated and poorly aerated lung has been marked by tracing a continuous green line. Pre-RM, pre-recruitment maneuver; post-RM, post-recruitment maneuver; upper row, apical section; middle row, hilum section; lower row, basal section. [Color figure can be seen in the online version of this article, available at http://wileyonlinelibrary.com/journal/ppul]