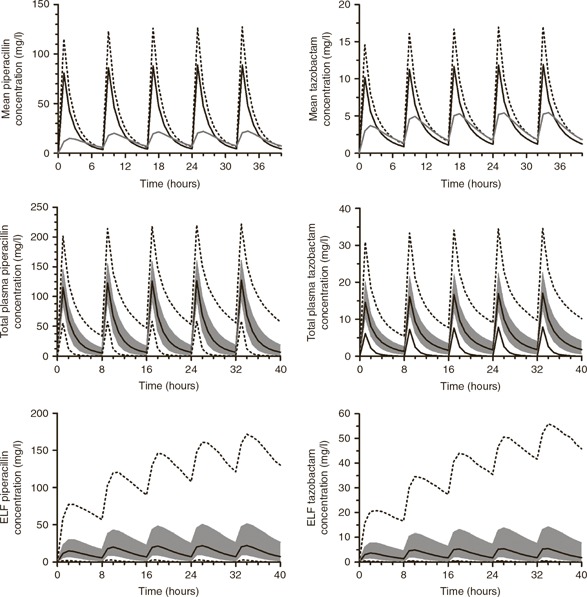
Figure 2.

concentration–time profiles for piperacillin (left) and tazobactam (right). The top panel compares total drug concentration (dotted line), unbound drug concentration (solid black line), and ELF drug concentration (solid gray line). The middle panels show unbound plasma concentration, and the lower two panels show ELF concentrations with median drug concentration (solid black line), the interquartile range (shaded gray area), and the 5th and 95th percentiles (dotted black lines). ELF, epithelial lining fluid.
