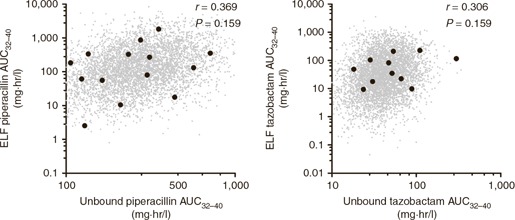
Figure 3.

Relationship between unbound plasma and ELF drug concentrations for piperacillin (left) and tazobactam (right) for each of the observed trial patients (black dots) and for 5,000 simulated patients (small gray dots). AUC, area under the concentration–time curve; ELF, epithelial lining fluid.
