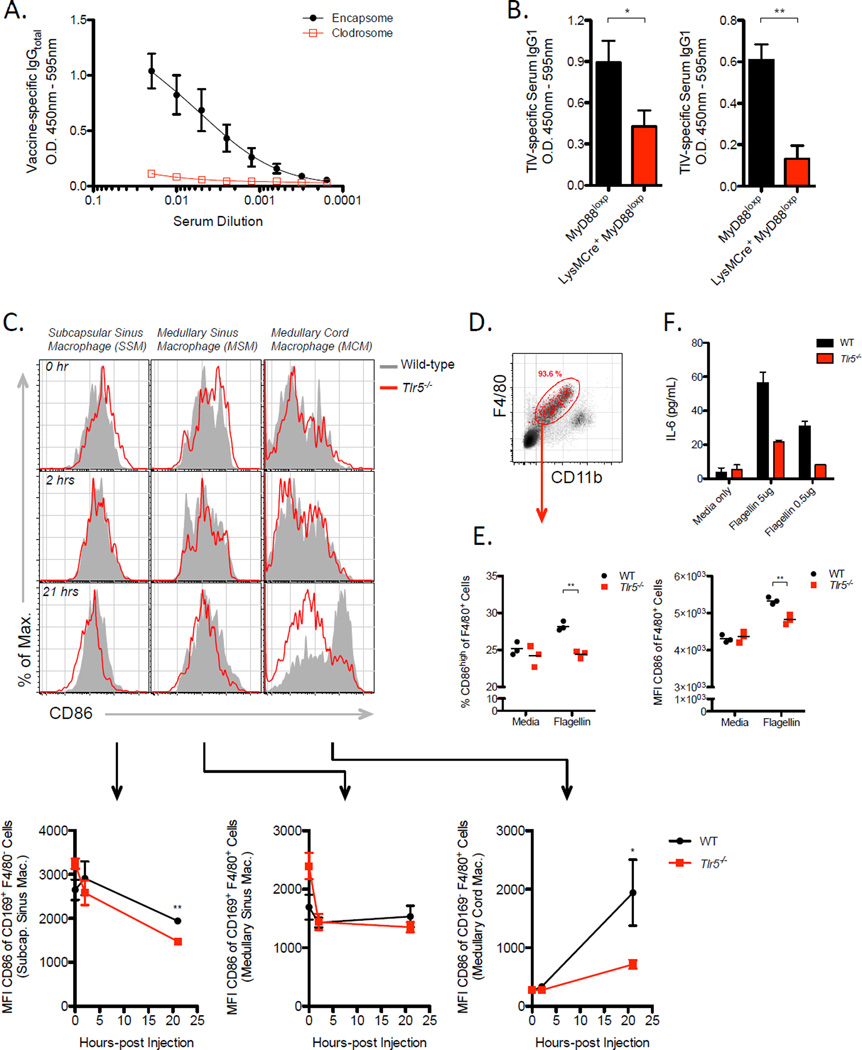
Figure 6. Flagellin activates multiple subsets of macrophages in the LN and induces IL-6 production in macrophages via TLR5.
(A) TIV-specific serum IgG levels at day 7-post vaccination in WT mice pre-treated with clodrosome or encapsome. Data shown are representative of two independent experiments and are expressed as the means ± SEM.
(B) TIV-specific serum IgG1 levels in LysMCre+ MyD88loxp or Cre- MyD88loxp mice at day 7-post vaccination. Two independent experiments are shown. Raw O.D. values were obtained using serum diluted by a factor of 1:100.
(C) Levels of CD86 expression on macrophage subsets in the dLN of mice following flagellin injection. The three major macrophage subsets in the LN were examined based on expression profiles of the following surface markers: CD169+F/80− (SSM), CD169+F4/80+ (MSM), CD169-F4/80+ (MCM) within CD11c-Ly6C- gated population of cells. Shown are representative histograms of surface CD86 levels (top) and the kinetics of CD86 MFI values shown as the means ± SEM (bottom).
(D–F) Flow-sorted macrophages were stimulated in vitro with flagellin for 24 hours.
(D) Representative dot plot depicts purity of macrophage isolation expressed in percent of gated cells.
(E) Relative frequencies of CD86+ cells or MFI values of CD86 expression
(F) Levels of IL-6 in culture supernatants expressed as means ± SEM. Data shown are representative of three independent experiments. See also Figure S6.

