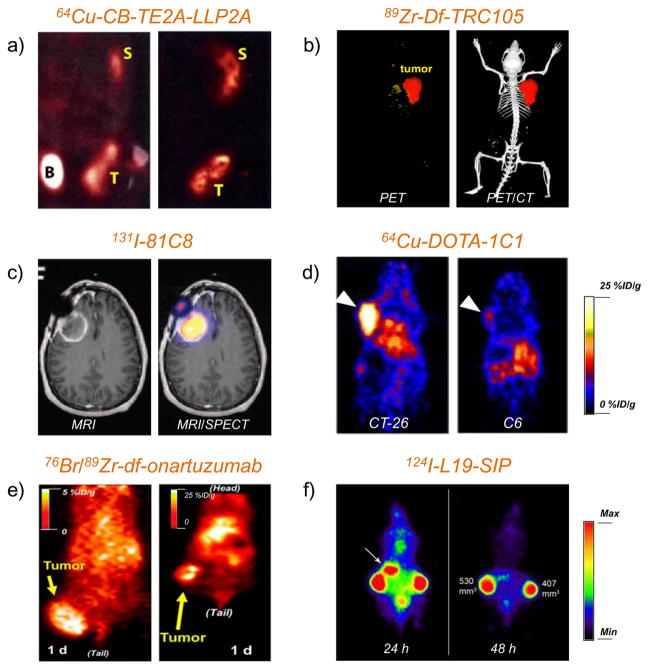
Figure 1. PET or SPECT imaging of vascular targets in cancer models.
(a) Small-animal PET/CT studies at 4 h p.i. of 64Cu-CB-TE2A-LLP2A in Raji tumor-bearing mice for detection of integrin α4β1 (VLA-4). T: tumor, B: bladder, S: spleen. Adapted with permission from [84]. (b) Representative PET/CT images of 89Zr-Df-TRC105 in 4T1 tumor-bearing mice for detection of CD105. Adapted with permission from [112]. (c) MRI/SPECT coregistered images of glioma patient injected with 131I-81C8 mAb for detection of tenascin-C positive tumor. Adapted with permission from [140]. Copyright by the Society of Nuclear Medicine and Molecular Imaging, Inc. (d) PET images of EphA2 with 64Cu-DOTA-1C1 in mice bearing CT-26 (EphA2-positive) and C6 (EphA2-negative) tumors. Tumors were marked by white arrows. Adapted with permission from [152]. (e) Representative coronal PET images of MKN-45 tumor on injected with 76Br-onartuzumab (left) and 89Zr-Df-onartuzumab (right) for imaging of c-Met. Adapted with permission from [164]. Copyright by the Society of Nuclear Medicine and Molecular Imaging, Inc. (f) PET images of FaDu xenograft-bearing nude mouse injected with 124I-L19-SIP for detection of ED-B. Uptake in stomach was marked by a white arrow. Adapted with permission from [175].

