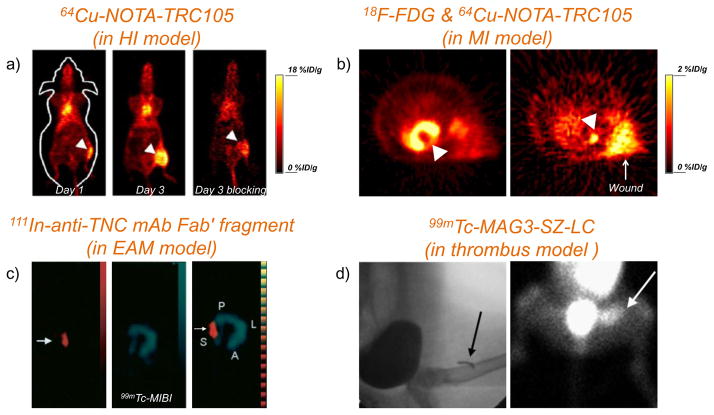
Figure 2. PET or SPECT imaging of vascular targets in cardiovascular disease models.
(a) Representative PET images at 48 h p.i. of 64Cu-NOTA-TRC105 on day 1 and day 3 after surgical creation of hindlimb ischemia (arrowheads) for detection of CD105. Corresponding PET image of mice in the blocking group on day 3 was also shown. Adapted with permission from [195]. (b) PET images with 64Cu-NOTA-TRC105 to detect CD105 expression in a rat myocardial infarction model (pointed by a white arrowhead). Left: PET imaging with 18F-FDG to confirm the presence of myocardial infarction after surgery (pointed by a white arrowhead). Tracer uptake in the wound (pointed by a white arrow) could also be observed. Adapted with permission from [197]. (c) SPECT images of 111In-anti-TNC Fab (left panel) and 99mTc-MIBI (middle panel) in EAM rats. The merged image of these two tracers is shown in the right panel. Adapted with permission from [198]. (d) Thrombus imaged with 99mTc-MAG3-SZ-LC. Arrows indicate the location of copper wire (left, detected by X-ray) and thrombus (right, detected by SPECT). Adapted with permission from [206].

