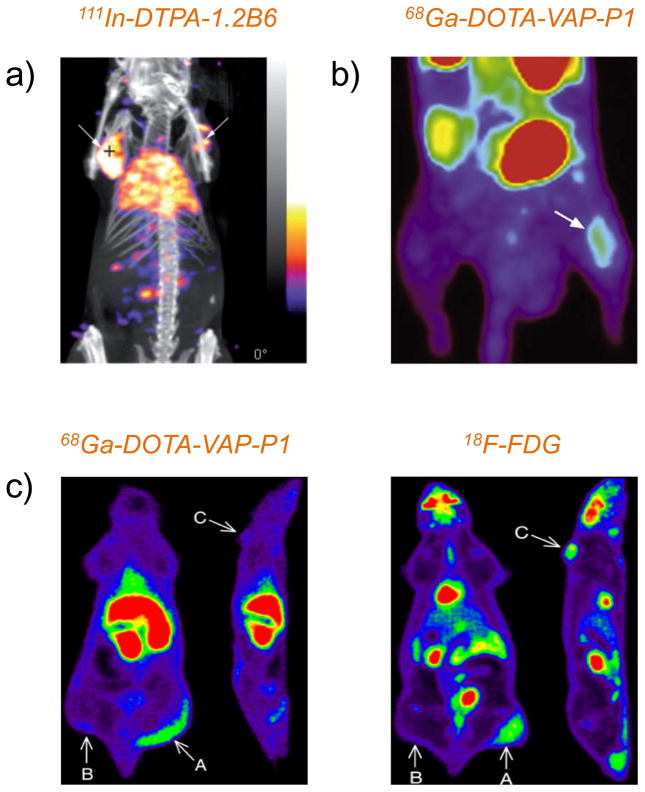
Figure 3. PET or SPECT imaging of vascular targets in inflammation.
(a) SPECT/CT imaging of a double-transplanted mouse injected with 111In-DTPA-1.2B6 at 5 h post-intragraft injection of TNF-α. White arrows indicated the transplanted synovial tissues. Adapted with permission from [226]. (b) Dynamic PET imaging of VAP-1 in osteomyelitic rat after intravenous administration of 68Ga-DOTA-VAP-P1. Clear visualization of the infection focus in the tibia (white arrow) with good target-to-background ratio could be observed. Adapted with permission from [233] (c) Representative whole-body coronal and sagittal PET images of a rat intravenously injected with 68Ga-DOTA-VAP-P1 (left) and 18F-FDG (right). Differences in the radioactivity uptake could be clearly seen at the site of inflammation (arrow A), the mouse muscle (arrow B) and the tumor (arrow C), which demonstrated that 68Ga-DOTA-VAP-P1 could discriminate between inflammation and cancer, while 18F-FDG could not. Adapted with permission from [234].

