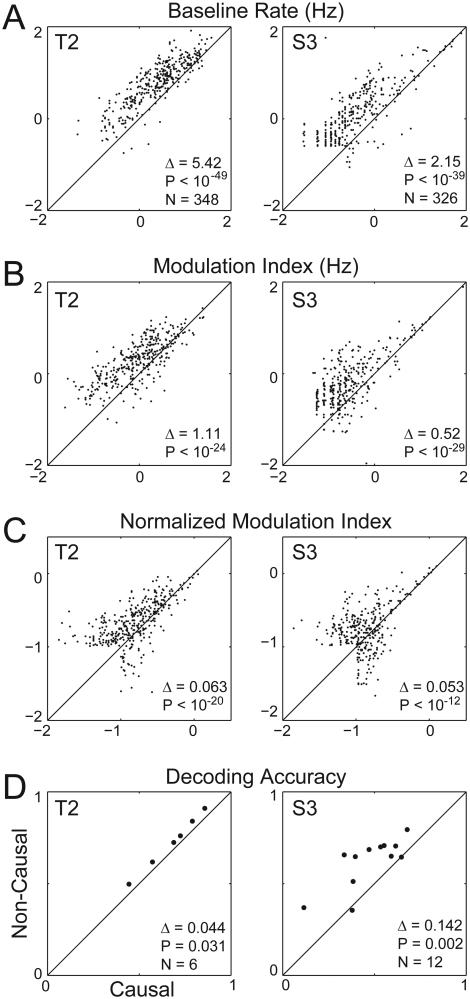
Figure 2.
Comparing tuning metrics between causal and non-causal threshold crossing events. (A) Scatter plot of baseline threshold crossing rates using the causal filter method (x-axis) versus baseline threshold crossing rates using the non-causal filter method, plotted on a log scale, for T2 (left column) and S3 (right column). Δ gives the mean difference in the baseline rates between the causal and non-causal filter methods. (B) Same as (A), except plotting modulation depth. (C) Same as (A), except plotting normalized modulation depths. (D) The decoding accuracy (defined as the mean dot product between the decoded and actual cursor direction) for the six T2 sessions (left column) and the twelve S3 sessions (right column).

