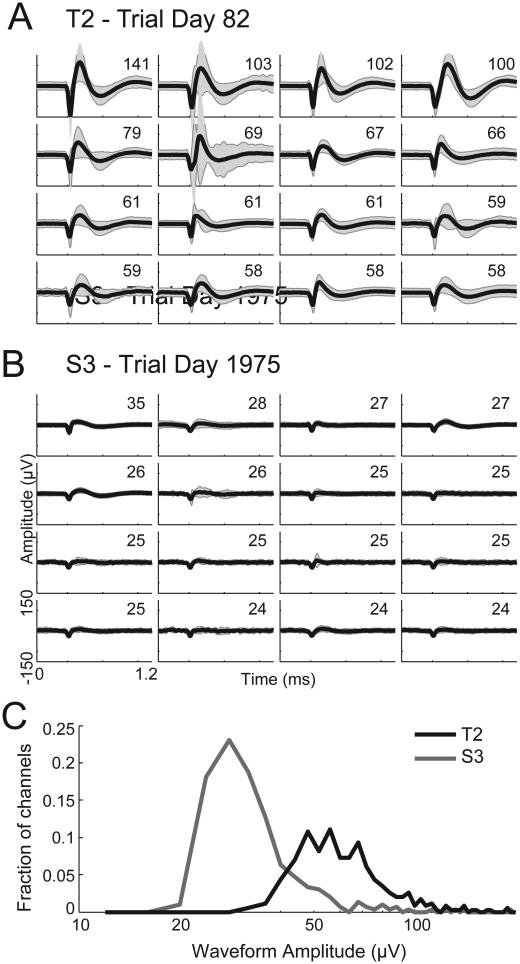
Figure 4.
Threshold crossing waveforms from the two participants. (A) The average waveform of threshold crossing events (black curve) ± 2 times the waveform standard deviation (grey shaded area) for the 16 channels with the largest waveform amplitudes (defined as the absolute value of the minimum of the mean waveform) recorded from T2 on trial day 82. The numbers in the top-right of each give the waveform amplitude (in μV), defined as the absolute value of the minimum of the mean waveform. (B) Same as (A), showing the waveforms recorded from S3 on trial day 1975. (C) Histogram of the mean waveform amplitudes (defined as the minimum of the mean of all waveforms that crossed the −4.5 times RMS threshold) for all 339 T2 channels (black curve) and all 303 S3 channels (grey curve). Waveforms for this plot were obtained from the non-causal filter method.

