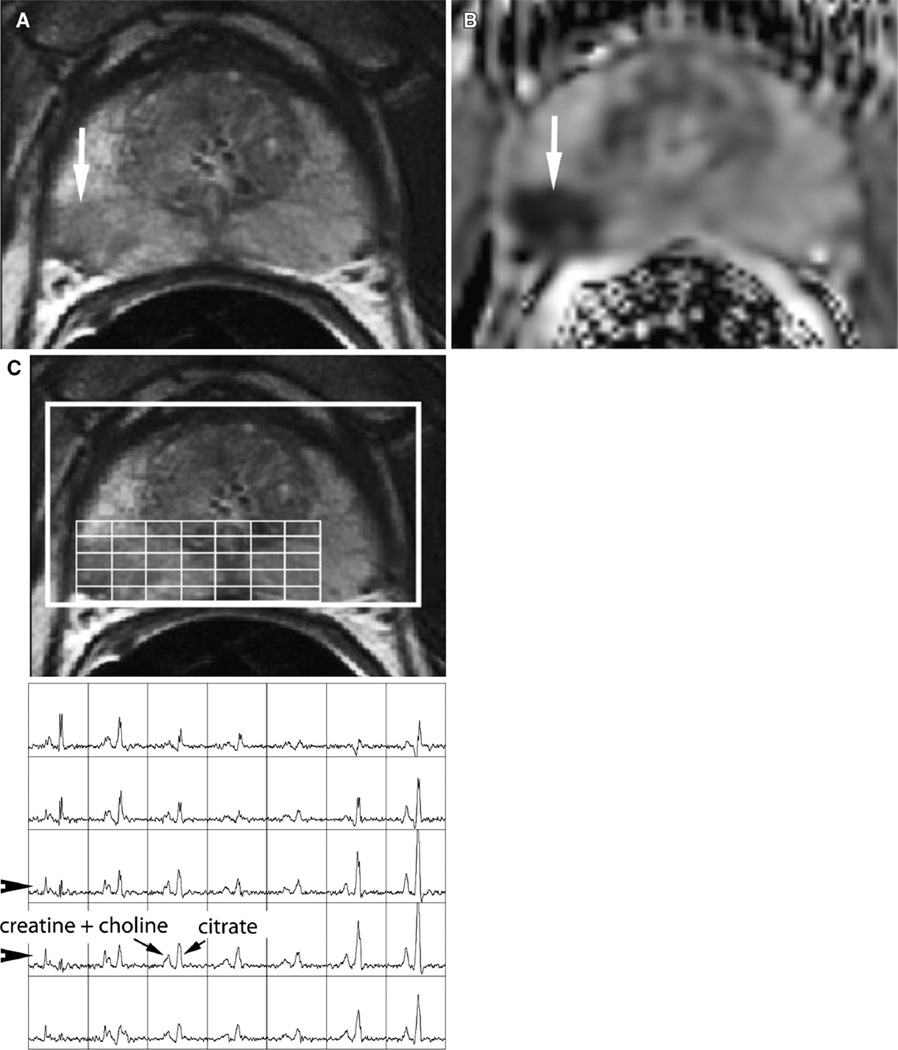
Figure 2.
A 68-year-old man with Gleason 3 + 3 prostate cancer, clinical stage T1c, PSA of 4.5 ng/mL. Follow-up transrectal ultrasound-guided biopsy performed 3 months after the MRI demonstrated Gleason 5 + 4 prostate cancer. A T2-weighted MRI shows a clear focus of low signal intensity in the peripheral zone of the right midgland gland (arrow). B Diffusion-weighted MRI shows a concordant abnormality with markedly reduced ADC (arrow). C MR spectroscopic imaging shows abnormal metabolism characterized by high choline and low citrate peaks in the region of the T2 abnormality (arrowheads).

