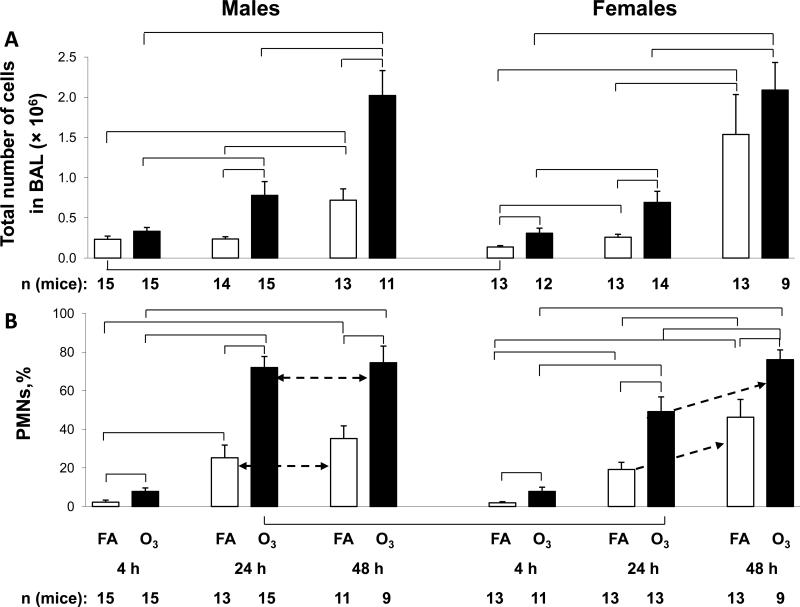
Figure 1.
BAL cell counts. Panel A. Total BAL cells from male and female mice were counted by hemocytometer and values from male and female are shown on separate graphs. The y-axis shows the total number of cells × 106. Brackets indicate groups that differ significantly from one another (p<0.05). Panel B. After performing a differential cell count on cytospin preparations, the % polymorphonuclear leukocytes (PMN) was determined and is graphed on the y-axis. Values from FA-exposed mice are shown in white bars and ozone-exposed mice in black bars. The differences between 24 and 48 h time points are shown with the dotted arrow. Exposure condition, time elapsed, and number of mice per point are shown below the x-axis.

