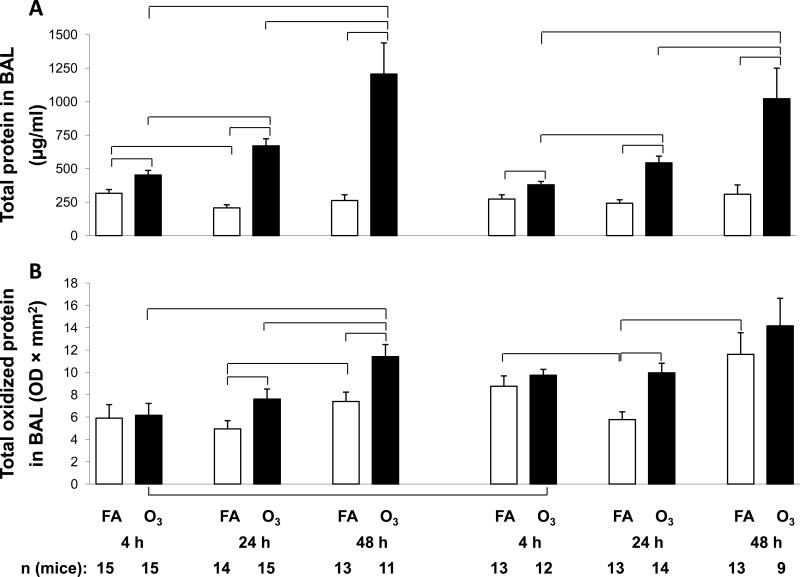
Figure 3.
Total and oxidized BAL protein. Panel A. BAL samples from male and female mice were subject to protein determinations and values (μg/ml) are graphed on the y-axis. Panel B. Total oxidized protein was determined by treating an aliquot of BAL protein with the OxyBlot Oxidized Protein Detection Kit and the densitometric values (OD × mm2) are graphed on the y-axis. X-axis and significance for both panels are as described in Figure 1.

