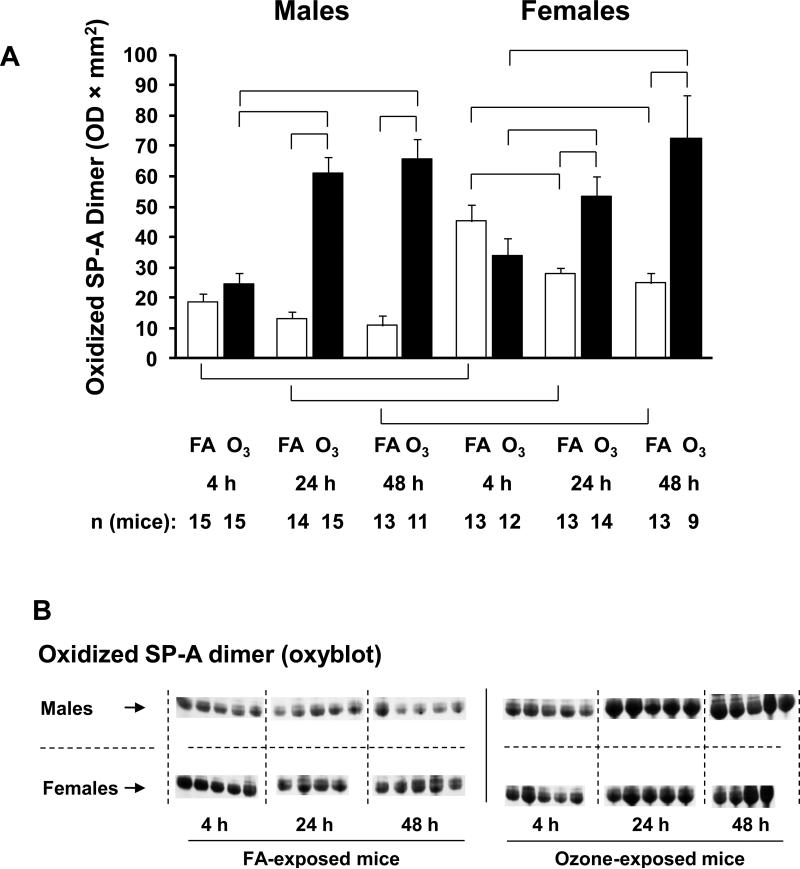
Figure 5.
Oxidized SP-A measurements in BAL samples from males and females. Panel A. Oxidized SP-A was determined by treating a Western blot (identical to that used in Figure 4) with the OxyBlot Protein Detection Kit and having its bands quantified by laser densitometry. Oxidation is only seen in the dimeric form of SP-A, and the dimeric SP-A values (OD × mm2) are graphed on the y-axis. X-axis, number of mice, and significance are as described in Figure 1. Panel B. A representative Western blot stained with the OxyBlot Kit is shown.

