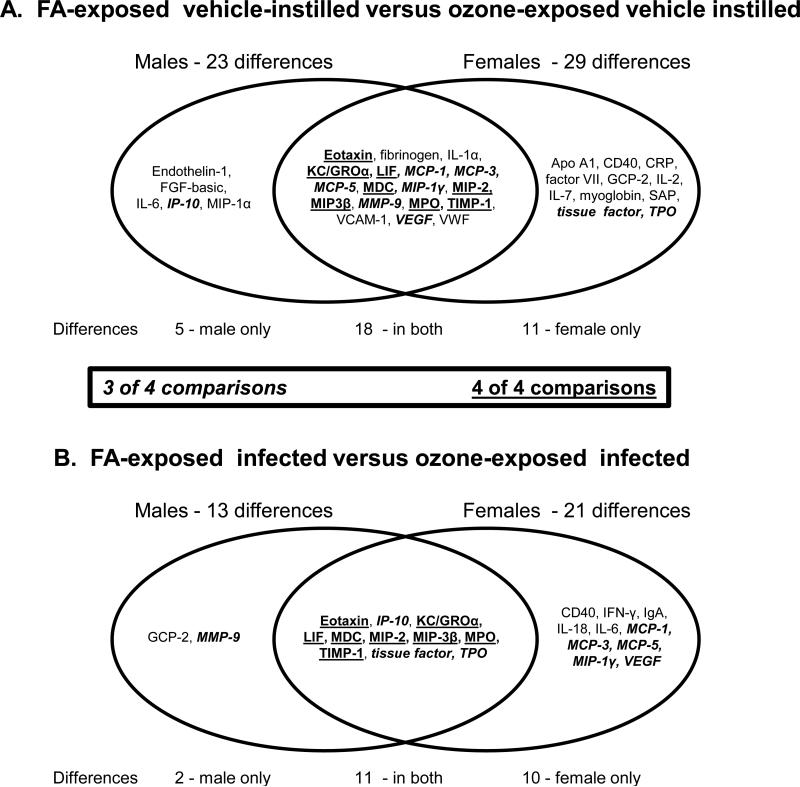
Figure 9.
Venn diagram of differences due to ozone exposure. Panel A. A Venn diagram shows the significant differences between FA- and ozone-exposed samples instilled with vehicle (uninfected). Differences in males are shown on the left and differences in females on the right. The overlapping area shows the changes seen in both sexes. Panel B. A similar diagram is shown depicting the differences between FA- and ozone-exposed that have been infected with pathogen. Differences in males are shown on the left and differences in females on the right. The overlapping area shows the changes seen in both sexes. Analytes that were significantly different in 3 of 4 comparisons (i.e. FA-exposed vs ozone-exposed – vehicle-instilled: 1) in males; 2) in females; FA-exposed vs ozone-exposed – infected – 3) in males; 4) in females) are italicized. Differences that were significant in all 4 comparisons are underlined.

