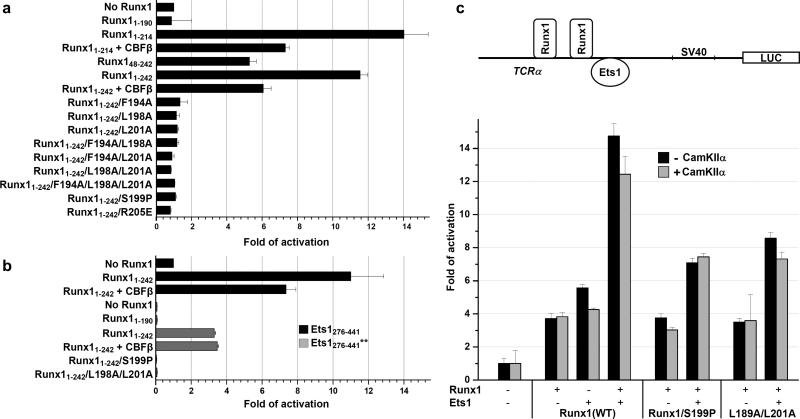
Figure 4. Ets1 activation by Runx1.
(a) DNA binding of Ets1280-441 to TCRα enhancer DNA in presence of various Runx1 proteins or Runx1•CBFβ1-141 complex. (b) DNA binding of Ets1276-441 and phosphorylated Ets1276-441** in presence of various Runx1 proteins or Runx1•CBFβ1-141 complex. In panels (a) and (b) the fold of Ets1 DNA binding activation is calculated from the average of dissociation constants obtained from three individual SPR measurements (Supplementary Tables 2 and 3). (c) Transient transfection assay showing transactivation of TCRα enhancer. Luciferase gene expression is driven by TCRα gene enhancer in 293T cell in presence and absence of constitutively active CaMKIIα. Fold of activation is calculated relative to the reporter only control. The standard deviations are calculated from three independent experiments with P < 0.05. The reporter construct used is current assay is shown above the graph.

