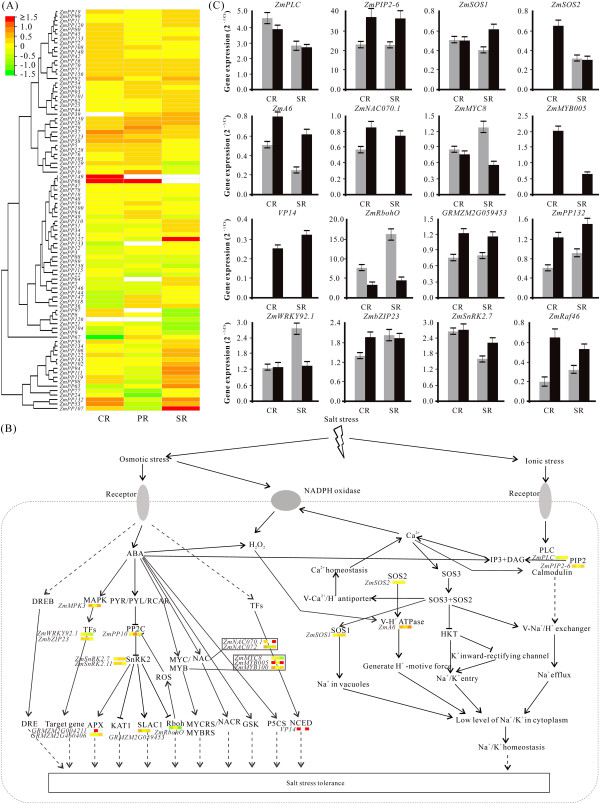
Figure 4.

Differential gene expression of ZmPP genes and overall signaling pathway under salt stress. A Expression profiles of ZmPPs under salt stress in crown root (CR), primary root (PR), and seminal root (SR). Log2 signal intensities were used to create the heatmap. White mean only expressed in control or have no expression value both in control and salt stress treatment. B Overview of salt-responsive systems in plants. C Real-time PCR results of salt-induced pathway components. Grey, control; black, salt treatment.
