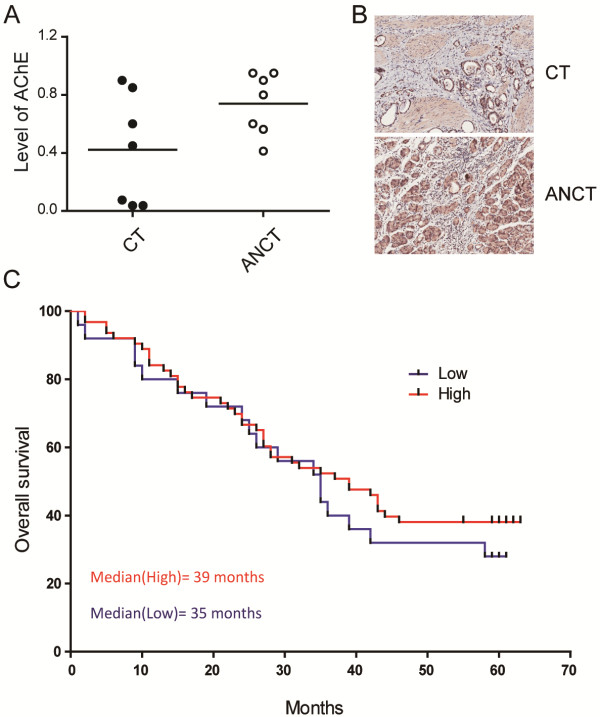
Figure 1.

The AChE expression in gastric cancers. (A) Expression of AChE in 7 gastric cancerous tissues (CT) and adjacent non-cancerous tissues (ANCT) as measured by immunohistochemistry staining. The expression of AChE was calculated as labelling intensity × percentage of positive cells and is displayed in a scatter plot. (B) Representative immunohistochemistry staining images of AChE expression in gastric samples (100×). (C) Overall survival rate of gastric cancer patients correlates with the expression level of AChE protein. n = 89.
