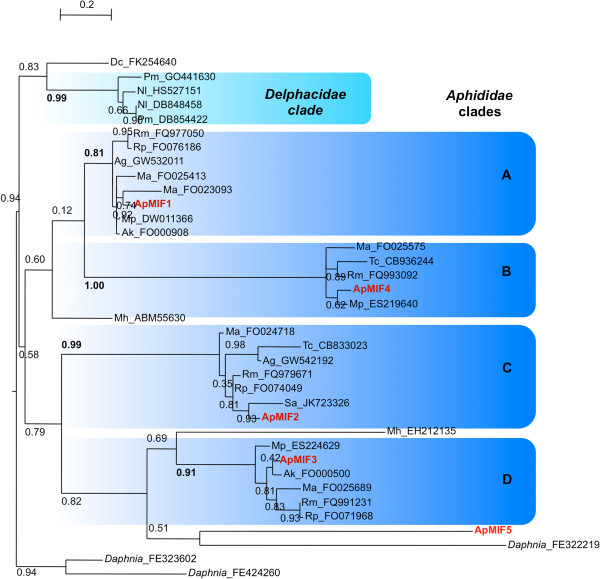
Figure 1.

Maximum likelyhood tree showing the phylogenetic relationship between full-length hemiptera MIF unisequences (listed in Table 3 ). Genbank accession numbers of the sequences used for the reconstruction are shown next to the species identification letters (2 letters as defined in Table 3). Clades that are specific of delphacidae or aphididae (A-D) are highlighted in light and dark blue, respectively. Values at nodes are bootstrap proportions. Bar: 0,2 substitution/site.
