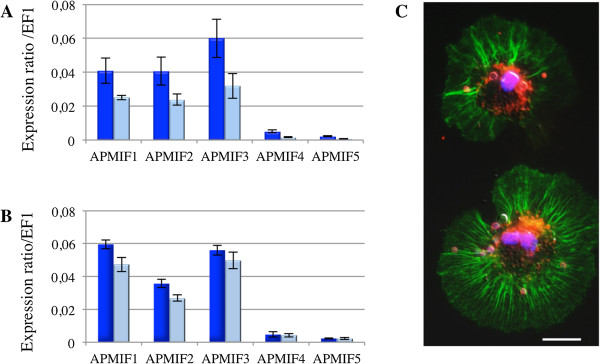
Figure 2.

Expression ratios (normalized to EF1 expression) of the five ApMIF transcripts in whole bodies (A) and hemocytes (B) from the A. pisum genetic lineages LL01 (dark blue) and YR2 (light blue). Each bar represents the mean expression ratio ± SD obtained from three independent experiments. (C) Immunolocalization of ApMIF1 in hemocytes. Merger of fluorescent micrographs showing two hemocytes with labeled actin (green fluorescence), nuclei (purple/bleu fluorescence) and ApMIF1 protein (orange fluorescence). Scale bar represents 10 μm.
