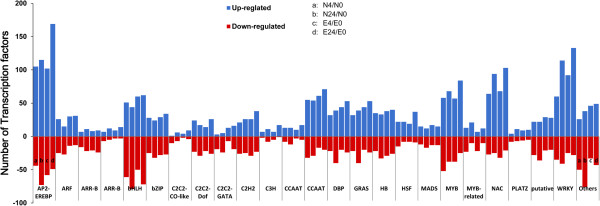
Figure 2.

Families of differentially expressed transcription factor unigenes from four comparisons. The x-axis indicates the distribution of different transcription factor families in the four comparisons, and the y-axis represents the number of differentially expressed (up- or down-regulated) unigenes in each transcription factor family. The four comparisons are N4/N0, N24/N0, E4/E0, and E24/E0, where N and E indicate Nan Dan Ba Di Da Hua and Earlistaple 7, respectively, treated with 200 mM NaCl for either 4 or 24 h compared with the non-treated control (0 h). Further information is presented in Additional file 2B.
