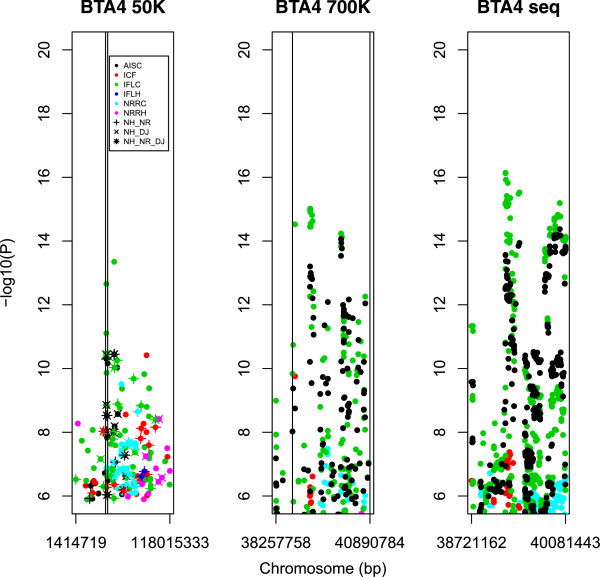
Figure 1.

Manhattan plots of GWAS on BTA04 for 5 female fertility traits with three densities of markers across successively narrower regions. The y axes show –log10(p-value) of single-marker associations tests. The x axes show marker positions in base pairs (bp). Left panel: tests across three breeds with BovineSNP50 BeadChip [6]. Vertical lines indicate the region shown in the middle panel. Center panel: tests in Holstein with the HD BeadChip. Vertical lines indicate the region shown in the right panel. Right panel: tests using sequence data for the Nordic Holstein breed.
